| Param | Original file | Final file |
|---|---|---|
| Filename | modeM0/AS1A04_229T01_9000002096cztM0_level2_bc.evt | modeM0/AS1A04_229T01_9000002096cztM0_level2_quad_clean.evt |
| Size (bytes) | 3,583,578,240 | 1,291,320,000 |
| Size | 3.3 GB | 1.2 GB |
| Events in quadrant A | 21,369,952 | 8,211,513 |
| Events in quadrant B | 25,262,416 | 8,554,965 |
| Events in quadrant C | 22,954,430 | 7,948,261 |
| Events in quadrant D | 32,182,828 | 7,595,686 |
| Mode M0 | |||
|---|---|---|---|
| Quadrant | BADHDUFLAG | Total packets | Discarded packets |
| A | 0 | 207290 | 0 |
| B | 0 | 220290 | 0 |
| C | 0 | 208333 | 0 |
| D | 0 | 239552 | 0 |
| Mode SS | |||
|---|---|---|---|
| Quadrant | BADHDUFLAG | Total packets | Discarded packets |
| A | 0 | 2020 | 0 |
| B | 0 | 2020 | 0 |
| C | 0 | 2020 | 0 |
| D | 0 | 2020 | 0 |
| Mode M9 | |||
|---|---|---|---|
| Quadrant | BADHDUFLAG | Total packets | Discarded packets |
| A | 0 | 136 | 0 |
| B | 0 | 136 | 0 |
| C | 0 | 136 | 0 |
| D | 0 | 136 | 0 |
| Quadrant | Total seconds | Saturated seconds | Saturation percentage |
|---|---|---|---|
| A | 99282 | 917 | 0.923632% |
| B | 99282 | 1827 | 1.840213% |
| C | 99282 | 801 | 0.806793% |
| D | 99282 | 1519 | 1.529985% |
Noise dominated data is calculated using 1-second bins in cleaned event files. If a bin has >2000 counts, and if more than 50% of those come from <1% of pixels, then it is considered to be noise-dominated and hence unusable.
| Quadrant | # 1 sec bins | Bins with >0 counts | Bins with >2000 counts | High rate bins dominated by noise | Noise dominated (total time) | Noise dominated (detector-on time) | Marked lightcurve |
|---|---|---|---|---|---|---|---|
| A | 112744 | 99282 | 8 | 8 | 0.01% | 0.01% | 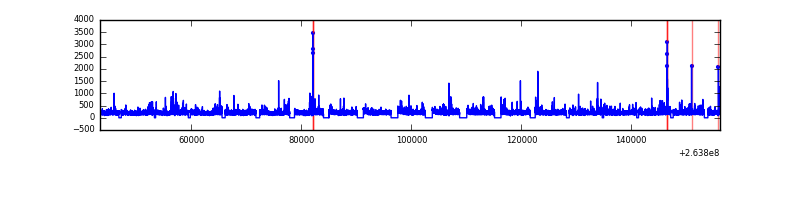 |
| B | 112744 | 99284 | 97 | 97 | 0.09% | 0.10% |  |
| C | 112744 | 99283 | 32 | 32 | 0.03% | 0.03% |  |
| D | 112744 | 99284 | 292 | 292 | 0.26% | 0.29% |  |
Top three noisy pixels from each quadrant. If the there are fewer than three noisy pixels in the level2.evt file, extra rows are filled as -1
| Pixel properties | Quadrant properties | ||||||
|---|---|---|---|---|---|---|---|
| Quadrant | DetID | PixID | Counts | Sigma | Mean | Median | Sigma |
| A | 12 | 189 | 481798 | 417.5 | 5296 | 5202 | 1141.6 |
| A | 8 | 15 | 129061 | 108.5 | 5296 | 5202 | 1141.6 |
| A | 12 | 96 | 109597 | 91.45 | 5296 | 5202 | 1141.6 |
| B | 0 | 219 | 1146808 | 1110.87 | 5394 | 5226 | 1027.6 |
| B | 0 | 85 | 909940 | 880.38 | 5394 | 5226 | 1027.6 |
| B | 10 | 252 | 522983 | 503.83 | 5394 | 5226 | 1027.6 |
| C | 3 | 233 | 2399551 | 2139.22 | 5110 | 5058 | 1119.3 |
| C | 0 | 207 | 447673 | 395.43 | 5110 | 5058 | 1119.3 |
| C | 14 | 234 | 64574 | 53.17 | 5110 | 5058 | 1119.3 |
| D | 8 | 195 | 5254780 | 4499.2 | 5081 | 4942 | 1166.8 |
| D | 10 | 157 | 1527323 | 1304.7 | 5081 | 4942 | 1166.8 |
| D | 7 | 254 | 1170295 | 998.73 | 5081 | 4942 | 1166.8 |
Histogram calculated using DETX and DETY for each event in the final _common_clean file
| Quadrant A | 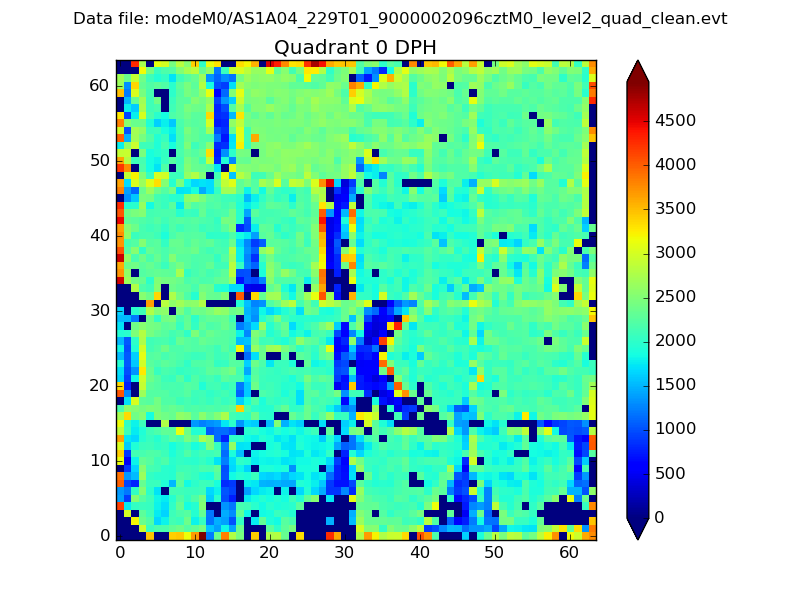 |
 |
Quadrant B |
|---|---|---|---|
| Quadrant D |  |
 |
Quadrant C |
| Plot type | Count rate plots | Images |
|---|---|---|
| Comparison with Poisson distribution Blue bars denote a histogram of data divided into 1 sec bins. Red curve is a Poisson curve with rate = median count rate of data. |
 |
 |
| Quadrant-wise count rates Data is divided into 100 sec bins |
 |
|
| Module-wise count rates for Quadrant A Data is divided into 100 sec bins |
 |
 |
| Module-wise count rates for Quadrant B Data is divided into 100 sec bins |
 |
 |
| Module-wise count rates for Quadrant C Data is divided into 100 sec bins |
 |
 |
| Module-wise count rates for Quadrant D Data is divided into 100 sec bins |
 |
 |
| Parameter | Plot |
|---|---|
| CZT HV Monitor |  |
| D_VDD |  |
| Temperature 1 |  |
| Veto HV Monitor |  |
| Veto LLD |  |
| Alpha Counter |  |
| _CPM_Rate |  |
| CZT Counter |  |
| +2.5 Volts monitor |  |
| +5 Volts monitor | 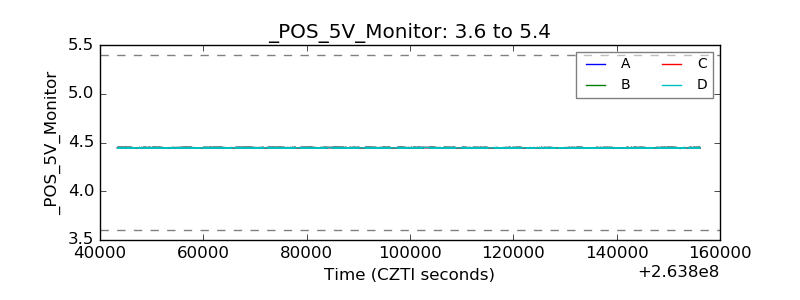 |
| _ROLL_ROT |  |
| _Roll_DEC |  |
| _Roll_RA |  |
| Veto Counter | 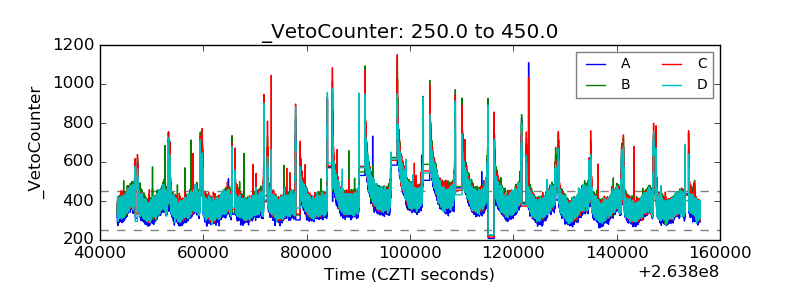 |