| Param | Original file | Final file |
|---|---|---|
| Filename | modeM0/AS1G08_045T01_9000002092cztM0_level2_bc.evt | modeM0/AS1G08_045T01_9000002092cztM0_level2_quad_clean.evt |
| Size (bytes) | 2,816,193,600 | 767,594,880 |
| Size | 2.6 GB | 732.0 MB |
| Events in quadrant A | 13,287,201 | 4,951,364 |
| Events in quadrant B | 29,804,159 | 4,941,242 |
| Events in quadrant C | 14,199,895 | 4,766,535 |
| Events in quadrant D | 23,963,278 | 4,524,063 |
| Mode M0 | |||
|---|---|---|---|
| Quadrant | BADHDUFLAG | Total packets | Discarded packets |
| A | 0 | 125681 | 0 |
| B | 0 | 198412 | 0 |
| C | 0 | 126012 | 0 |
| D | 0 | 158539 | 0 |
| Mode SS | |||
|---|---|---|---|
| Quadrant | BADHDUFLAG | Total packets | Discarded packets |
| A | 0 | 1202 | 0 |
| B | 0 | 1202 | 0 |
| C | 0 | 1202 | 0 |
| D | 0 | 1202 | 0 |
| Mode M9 | |||
|---|---|---|---|
| Quadrant | BADHDUFLAG | Total packets | Discarded packets |
| A | 0 | 95 | 0 |
| B | 0 | 95 | 0 |
| C | 0 | 95 | 0 |
| D | 0 | 95 | 0 |
| Quadrant | Total seconds | Saturated seconds | Saturation percentage |
|---|---|---|---|
| A | 59286 | 664 | 1.119995% |
| B | 59286 | 8851 | 14.929326% |
| C | 59286 | 472 | 0.796141% |
| D | 59286 | 1246 | 2.101677% |
Noise dominated data is calculated using 1-second bins in cleaned event files. If a bin has >2000 counts, and if more than 50% of those come from <1% of pixels, then it is considered to be noise-dominated and hence unusable.
| Quadrant | # 1 sec bins | Bins with >0 counts | Bins with >2000 counts | High rate bins dominated by noise | Noise dominated (total time) | Noise dominated (detector-on time) | Marked lightcurve |
|---|---|---|---|---|---|---|---|
| A | 68587 | 59287 | 7 | 7 | 0.01% | 0.01% |  |
| B | 68587 | 59271 | 189 | 189 | 0.28% | 0.32% |  |
| C | 68587 | 59288 | 1 | 1 | 0.00% | 0.00% | 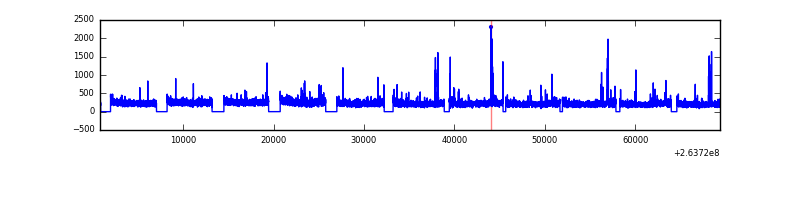 |
| D | 68587 | 59287 | 275 | 275 | 0.40% | 0.46% |  |
Top three noisy pixels from each quadrant. If the there are fewer than three noisy pixels in the level2.evt file, extra rows are filled as -1
| Pixel properties | Quadrant properties | ||||||
|---|---|---|---|---|---|---|---|
| Quadrant | DetID | PixID | Counts | Sigma | Mean | Median | Sigma |
| A | 12 | 189 | 470453 | 671.77 | 3231 | 3179 | 695.6 |
| A | 9 | 143 | 182133 | 257.27 | 3231 | 3179 | 695.6 |
| A | 8 | 15 | 104455 | 145.6 | 3231 | 3179 | 695.6 |
| B | 0 | 85 | 16418389 | 27634.17 | 3099 | 3011 | 594.0 |
| B | 0 | 189 | 433765 | 725.14 | 3099 | 3011 | 594.0 |
| B | 3 | 209 | 308020 | 513.46 | 3099 | 3011 | 594.0 |
| C | 3 | 233 | 1752986 | 2576.59 | 3104 | 3073 | 679.2 |
| C | 0 | 207 | 219673 | 318.92 | 3104 | 3073 | 679.2 |
| C | 10 | 22 | 41738 | 56.93 | 3104 | 3073 | 679.2 |
| D | 8 | 195 | 4761748 | 6740.2 | 3077 | 2996 | 706.0 |
| D | 1 | 52 | 3075136 | 4351.32 | 3077 | 2996 | 706.0 |
| D | 12 | 110 | 1489984 | 2106.14 | 3077 | 2996 | 706.0 |
Histogram calculated using DETX and DETY for each event in the final _common_clean file
| Quadrant A |  |
 |
Quadrant B |
|---|---|---|---|
| Quadrant D | 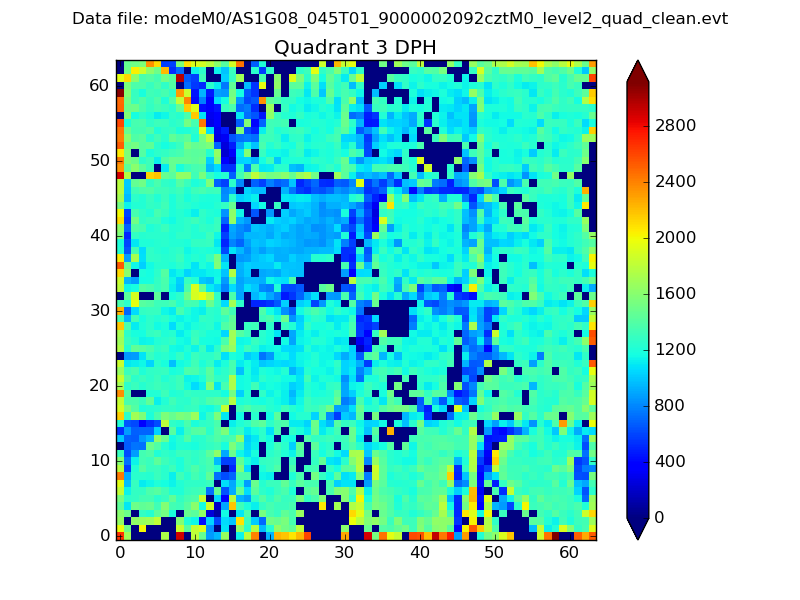 |
 |
Quadrant C |
| Plot type | Count rate plots | Images |
|---|---|---|
| Comparison with Poisson distribution Blue bars denote a histogram of data divided into 1 sec bins. Red curve is a Poisson curve with rate = median count rate of data. |
 |
 |
| Quadrant-wise count rates Data is divided into 100 sec bins |
 |
|
| Module-wise count rates for Quadrant A Data is divided into 100 sec bins |
 |
 |
| Module-wise count rates for Quadrant B Data is divided into 100 sec bins |
 |
 |
| Module-wise count rates for Quadrant C Data is divided into 100 sec bins |
 |
 |
| Module-wise count rates for Quadrant D Data is divided into 100 sec bins |
 |
 |
| Parameter | Plot |
|---|---|
| CZT HV Monitor |  |
| D_VDD |  |
| Temperature 1 |  |
| Veto HV Monitor |  |
| Veto LLD |  |
| Alpha Counter |  |
| _CPM_Rate | 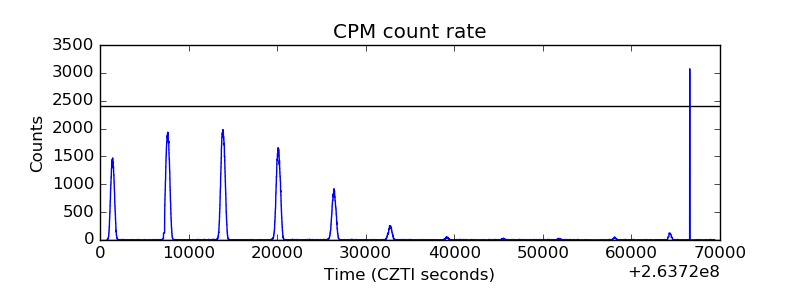 |
| CZT Counter |  |
| +2.5 Volts monitor |  |
| +5 Volts monitor |  |
| _ROLL_ROT |  |
| _Roll_DEC | 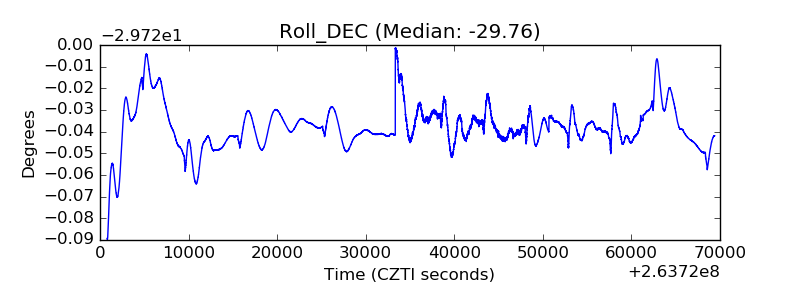 |
| _Roll_RA | 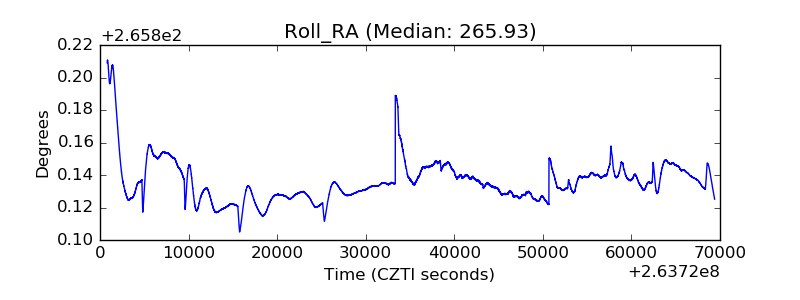 |
| Veto Counter |  |