| Param | Original file | Final file |
|---|---|---|
| Filename | modeM0/AS1G08_068T01_9000002090cztM0_level2_bc.evt | modeM0/AS1G08_068T01_9000002090cztM0_level2_quad_clean.evt |
| Size (bytes) | 892,958,400 | 271,160,640 |
| Size | 851.6 MB | 258.6 MB |
| Events in quadrant A | 4,786,333 | 1,683,810 |
| Events in quadrant B | 5,355,198 | 1,762,512 |
| Events in quadrant C | 5,767,127 | 1,629,285 |
| Events in quadrant D | 9,545,738 | 1,537,712 |
| Mode M9 | |||
|---|---|---|---|
| Quadrant | BADHDUFLAG | Total packets | Discarded packets |
| A | 0 | 23 | 0 |
| B | 0 | 23 | 0 |
| C | 0 | 23 | 0 |
| D | 0 | 23 | 0 |
| Mode M0 | |||
|---|---|---|---|
| Quadrant | BADHDUFLAG | Total packets | Discarded packets |
| A | 0 | 47467 | 0 |
| B | 0 | 49237 | 0 |
| C | 0 | 48676 | 0 |
| D | 0 | 65307 | 0 |
| Mode SS | |||
|---|---|---|---|
| Quadrant | BADHDUFLAG | Total packets | Discarded packets |
| A | 0 | 472 | 0 |
| B | 0 | 472 | 0 |
| C | 0 | 472 | 0 |
| D | 0 | 472 | 0 |
| Quadrant | Total seconds | Saturated seconds | Saturation percentage |
|---|---|---|---|
| A | 23236 | 131 | 0.563780% |
| B | 23236 | 164 | 0.705801% |
| C | 23236 | 92 | 0.395937% |
| D | 23236 | 1759 | 7.570150% |
Noise dominated data is calculated using 1-second bins in cleaned event files. If a bin has >2000 counts, and if more than 50% of those come from <1% of pixels, then it is considered to be noise-dominated and hence unusable.
| Quadrant | # 1 sec bins | Bins with >0 counts | Bins with >2000 counts | High rate bins dominated by noise | Noise dominated (total time) | Noise dominated (detector-on time) | Marked lightcurve |
|---|---|---|---|---|---|---|---|
| A | 28742 | 23238 | 2 | 2 | 0.01% | 0.01% |  |
| B | 28742 | 23238 | 4 | 4 | 0.01% | 0.02% |  |
| C | 28742 | 23238 | 0 | 0 | 0.00% | 0.00% |  |
| D | 28742 | 23232 | 198 | 198 | 0.69% | 0.85% |  |
Top three noisy pixels from each quadrant. If the there are fewer than three noisy pixels in the level2.evt file, extra rows are filled as -1
| Pixel properties | Quadrant properties | ||||||
|---|---|---|---|---|---|---|---|
| Quadrant | DetID | PixID | Counts | Sigma | Mean | Median | Sigma |
| A | 8 | 15 | 84314 | 317.18 | 1190 | 1166 | 262.2 |
| A | 12 | 189 | 61035 | 228.38 | 1190 | 1166 | 262.2 |
| A | 12 | 96 | 49231 | 183.35 | 1190 | 1166 | 262.2 |
| B | 0 | 85 | 170334 | 715.46 | 1214 | 1178 | 236.4 |
| B | 0 | 189 | 147388 | 618.41 | 1214 | 1178 | 236.4 |
| B | 3 | 209 | 143950 | 603.87 | 1214 | 1178 | 236.4 |
| C | 3 | 233 | 1251530 | 4859.34 | 1152 | 1139 | 257.3 |
| C | 10 | 22 | 9769 | 33.54 | 1152 | 1139 | 257.3 |
| C | 13 | 61 | 6560 | 21.07 | 1152 | 1139 | 257.3 |
| D | 10 | 157 | 2842720 | 10896.75 | 1113 | 1083 | 260.8 |
| D | 1 | 52 | 966074 | 3700.42 | 1113 | 1083 | 260.8 |
| D | 12 | 110 | 430370 | 1646.17 | 1113 | 1083 | 260.8 |
Histogram calculated using DETX and DETY for each event in the final _common_clean file
| Quadrant A |  |
 |
Quadrant B |
|---|---|---|---|
| Quadrant D | 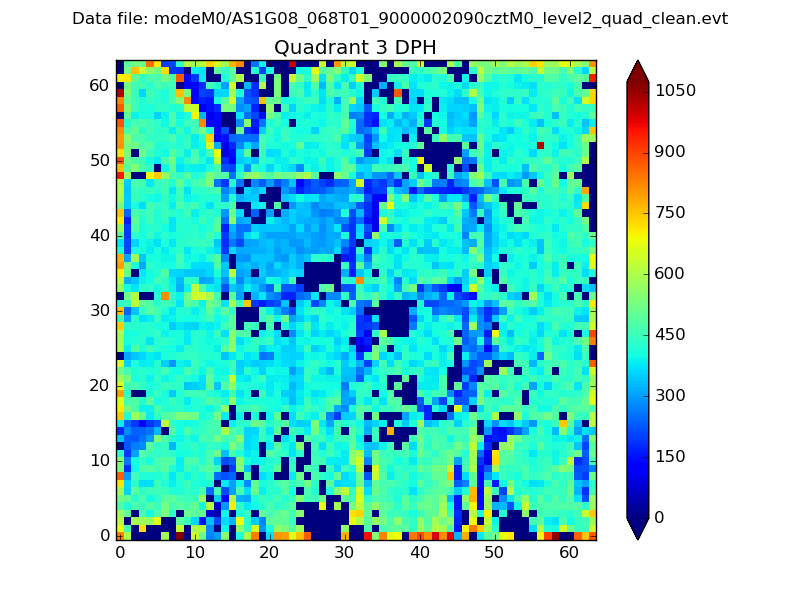 |
 |
Quadrant C |
| Plot type | Count rate plots | Images |
|---|---|---|
| Comparison with Poisson distribution Blue bars denote a histogram of data divided into 1 sec bins. Red curve is a Poisson curve with rate = median count rate of data. |
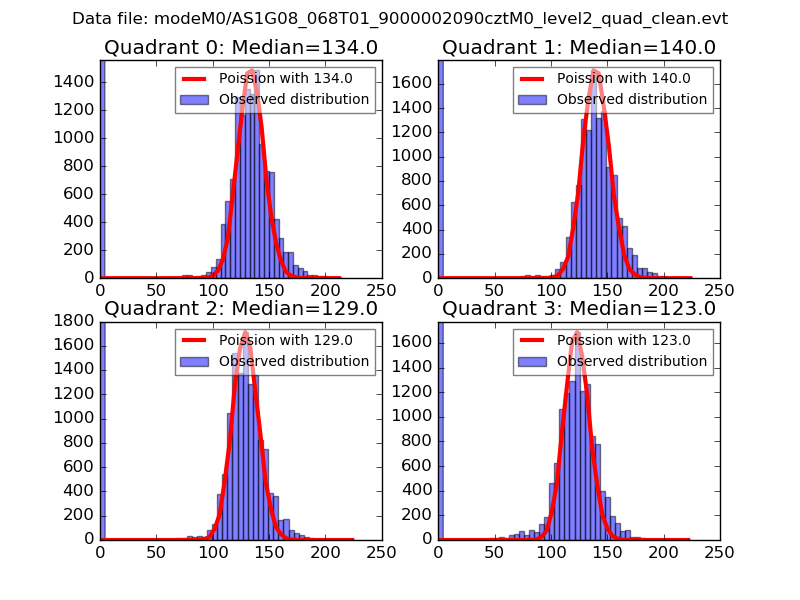 |
 |
| Quadrant-wise count rates Data is divided into 100 sec bins |
 |
|
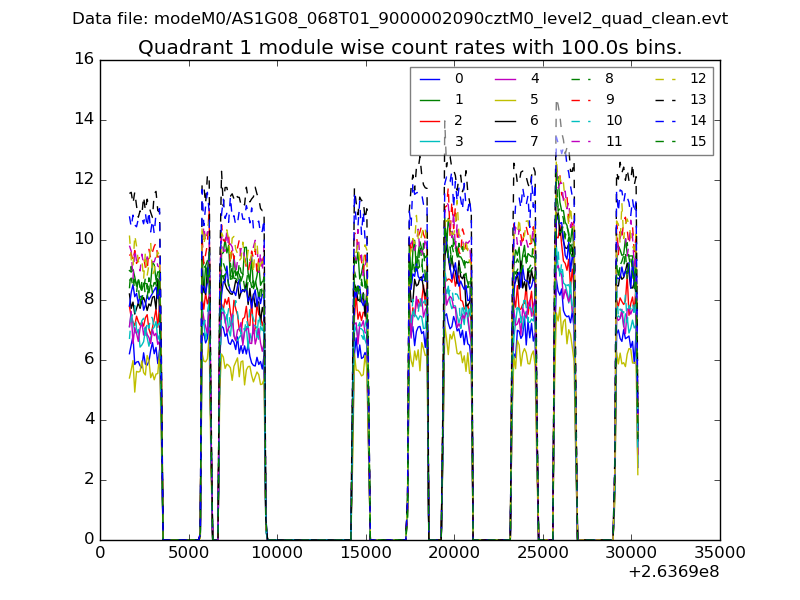
| Module-wise count rates for Quadrant A Data is divided into 100 sec bins |
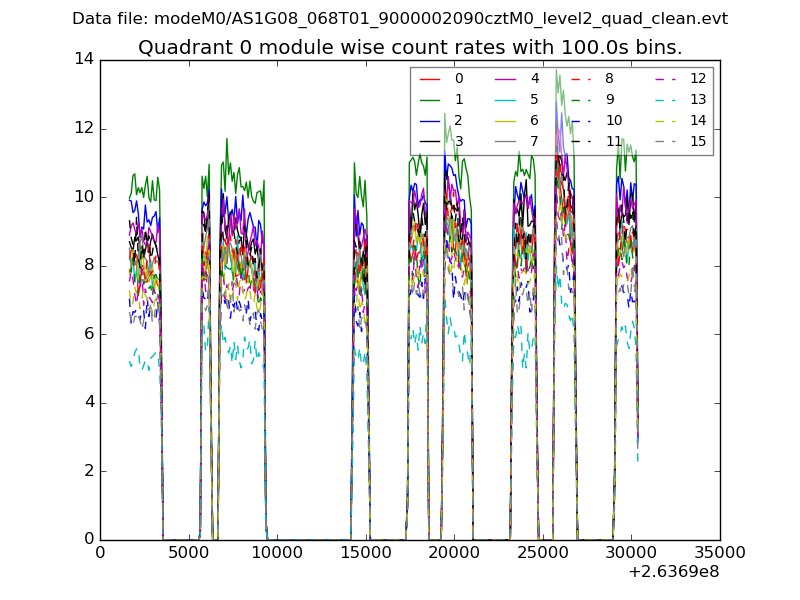 |
 |
| Module-wise count rates for Quadrant B Data is divided into 100 sec bins |
 |
 |
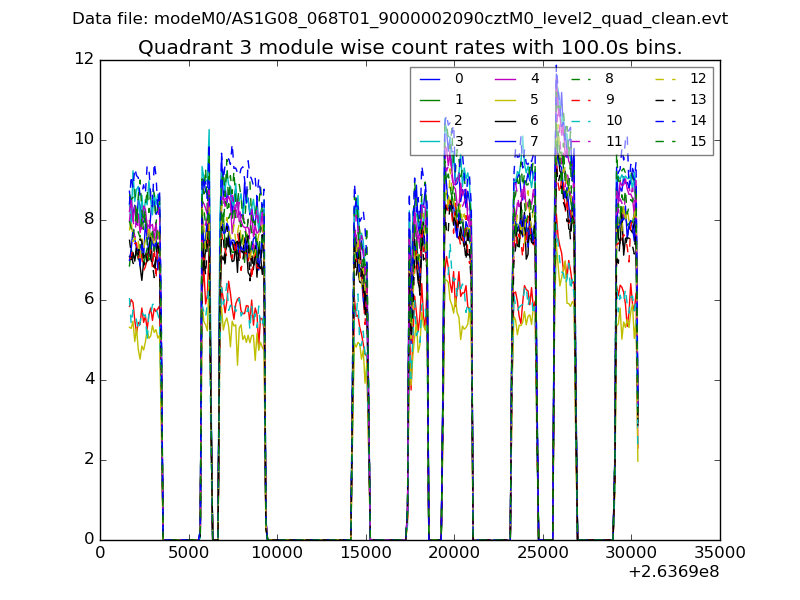
| Module-wise count rates for Quadrant C Data is divided into 100 sec bins |
 |
 |
| Module-wise count rates for Quadrant D Data is divided into 100 sec bins |
 |
 |
| Parameter | Plot |
|---|---|
| CZT HV Monitor |  |
| D_VDD |  |
| Temperature 1 |  |
| Veto HV Monitor | 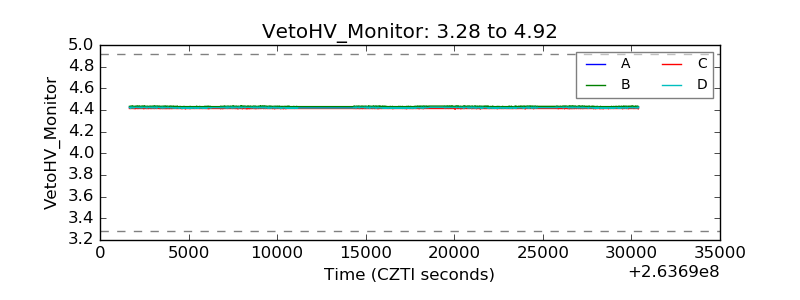 |
| Veto LLD |  |
| Alpha Counter |  |
| _CPM_Rate |  |
| CZT Counter |  |
| +2.5 Volts monitor |  |
| +5 Volts monitor | 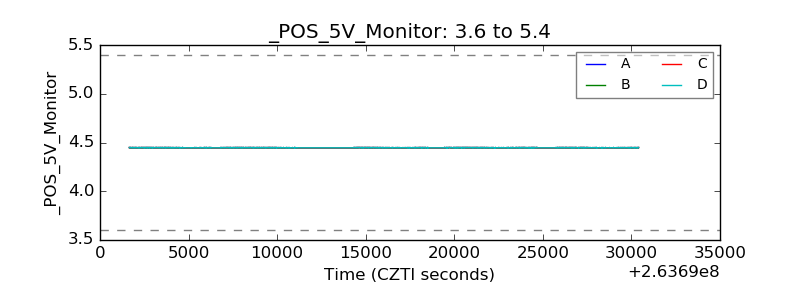 |
| _ROLL_ROT |  |
| _Roll_DEC |  |
| _Roll_RA |  |
| Veto Counter |  |