| Param | Original file | Final file |
|---|---|---|
| Filename | modeM0/AS1A04_224T05_9000002088cztM0_level2_bc.evt | modeM0/AS1A04_224T05_9000002088cztM0_level2_quad_clean.evt |
| Size (bytes) | 772,056,000 | 250,640,640 |
| Size | 736.3 MB | 239.0 MB |
| Events in quadrant A | 4,266,663 | 1,538,694 |
| Events in quadrant B | 4,189,631 | 1,566,203 |
| Events in quadrant C | 4,828,287 | 1,607,382 |
| Events in quadrant D | 8,708,006 | 1,480,751 |
| Mode SS | |||
|---|---|---|---|
| Quadrant | BADHDUFLAG | Total packets | Discarded packets |
| A | 0 | 418 | 0 |
| B | 0 | 418 | 0 |
| C | 0 | 418 | 0 |
| D | 0 | 418 | 0 |
| Mode M9 | |||
|---|---|---|---|
| Quadrant | BADHDUFLAG | Total packets | Discarded packets |
| A | 0 | 14 | 0 |
| B | 0 | 14 | 0 |
| C | 0 | 14 | 0 |
| D | 0 | 14 | 0 |
| Mode M0 | |||
|---|---|---|---|
| Quadrant | BADHDUFLAG | Total packets | Discarded packets |
| A | 0 | 42801 | 0 |
| B | 0 | 42834 | 0 |
| C | 0 | 43169 | 0 |
| D | 0 | 56611 | 0 |
| Quadrant | Total seconds | Saturated seconds | Saturation percentage |
|---|---|---|---|
| A | 20283 | 255 | 1.257210% |
| B | 20283 | 382 | 1.883351% |
| C | 20283 | 225 | 1.109303% |
| D | 20283 | 1392 | 6.862890% |
Noise dominated data is calculated using 1-second bins in cleaned event files. If a bin has >2000 counts, and if more than 50% of those come from <1% of pixels, then it is considered to be noise-dominated and hence unusable.
| Quadrant | # 1 sec bins | Bins with >0 counts | Bins with >2000 counts | High rate bins dominated by noise | Noise dominated (total time) | Noise dominated (detector-on time) | Marked lightcurve |
|---|---|---|---|---|---|---|---|
| A | 21879 | 20285 | 0 | 0 | 0.00% | 0.00% |  |
| B | 21879 | 20284 | 0 | 0 | 0.00% | 0.00% |  |
| C | 21879 | 20284 | 0 | 0 | 0.00% | 0.00% | 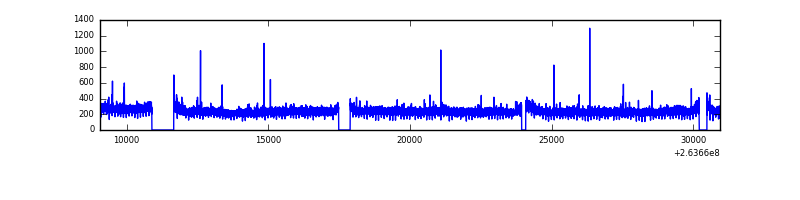 |
| D | 21879 | 20283 | 734 | 734 | 3.35% | 3.62% |  |
Top three noisy pixels from each quadrant. If the there are fewer than three noisy pixels in the level2.evt file, extra rows are filled as -1
| Pixel properties | Quadrant properties | ||||||
|---|---|---|---|---|---|---|---|
| Quadrant | DetID | PixID | Counts | Sigma | Mean | Median | Sigma |
| A | 12 | 189 | 125813 | 546.12 | 1033 | 1007 | 228.5 |
| A | 8 | 15 | 70709 | 305.0 | 1033 | 1007 | 228.5 |
| A | 12 | 96 | 66397 | 286.13 | 1033 | 1007 | 228.5 |
| B | 0 | 214 | 60723 | 296.29 | 1041 | 1010 | 201.5 |
| B | 3 | 209 | 38304 | 185.05 | 1041 | 1010 | 201.5 |
| B | 0 | 189 | 36569 | 176.44 | 1041 | 1010 | 201.5 |
| C | 3 | 233 | 756903 | 3153.39 | 1038 | 1018 | 239.7 |
| C | 14 | 234 | 9315 | 34.61 | 1038 | 1018 | 239.7 |
| C | 10 | 22 | 7195 | 25.77 | 1038 | 1018 | 239.7 |
| D | 1 | 52 | 4208648 | 17816.21 | 1003 | 970 | 236.2 |
| D | 7 | 80 | 260604 | 1099.35 | 1003 | 970 | 236.2 |
| D | 8 | 195 | 156843 | 660.0 | 1003 | 970 | 236.2 |
Histogram calculated using DETX and DETY for each event in the final _common_clean file
| Quadrant A | 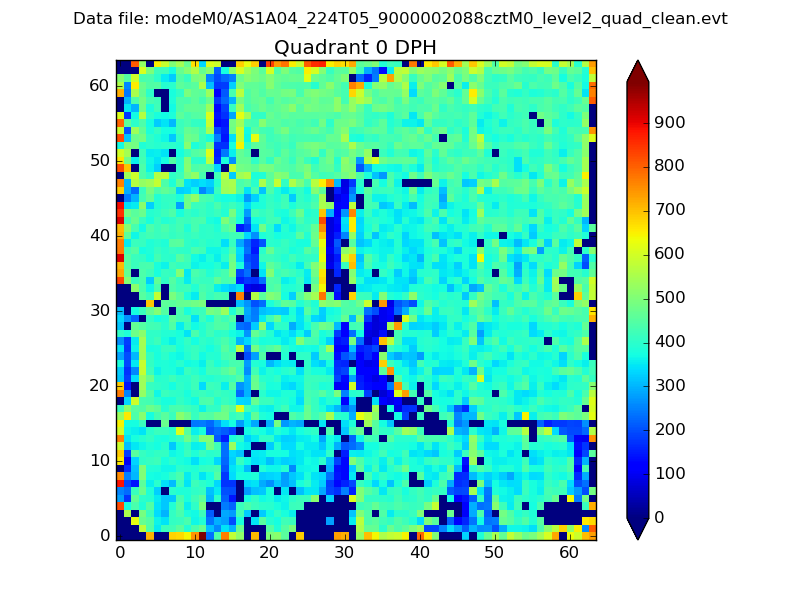 |
 |
Quadrant B |
|---|---|---|---|
| Quadrant D |  |
 |
Quadrant C |
| Plot type | Count rate plots | Images |
|---|---|---|
| Comparison with Poisson distribution Blue bars denote a histogram of data divided into 1 sec bins. Red curve is a Poisson curve with rate = median count rate of data. |
 |
 |
| Quadrant-wise count rates Data is divided into 100 sec bins |
 |
|
| Module-wise count rates for Quadrant A Data is divided into 100 sec bins |
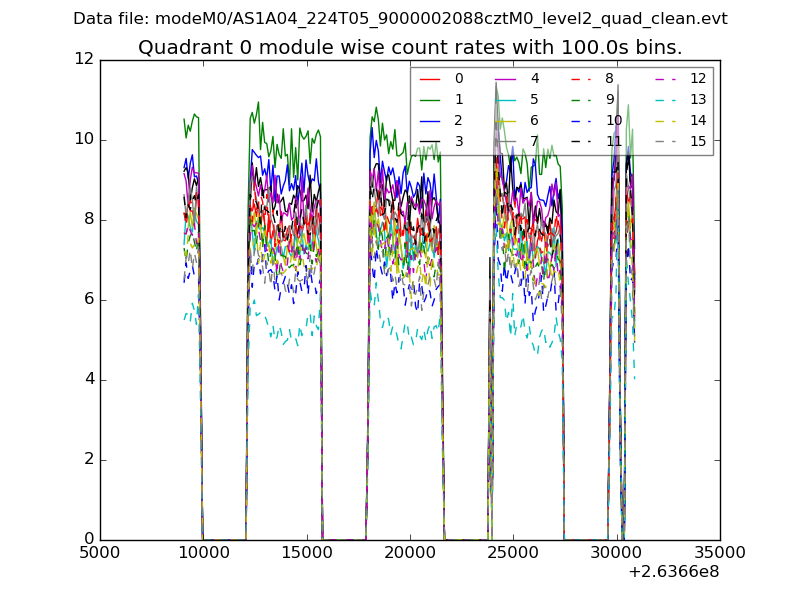 |
 |
| Module-wise count rates for Quadrant B Data is divided into 100 sec bins |
 |
 |
| Module-wise count rates for Quadrant C Data is divided into 100 sec bins |
 |
 |
| Module-wise count rates for Quadrant D Data is divided into 100 sec bins |
 |
 |
| Parameter | Plot |
|---|---|
| CZT HV Monitor |  |
| D_VDD |  |
| Temperature 1 |  |
| Veto HV Monitor | 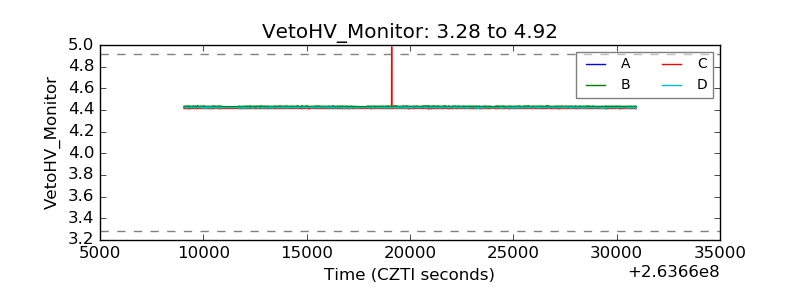 |
| Veto LLD | 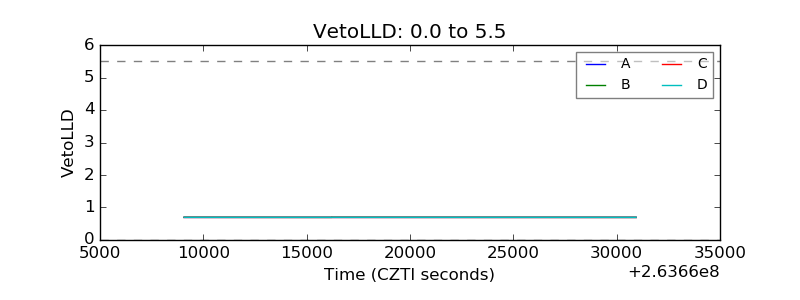 |
| Alpha Counter |  |
| _CPM_Rate |  |
| CZT Counter | 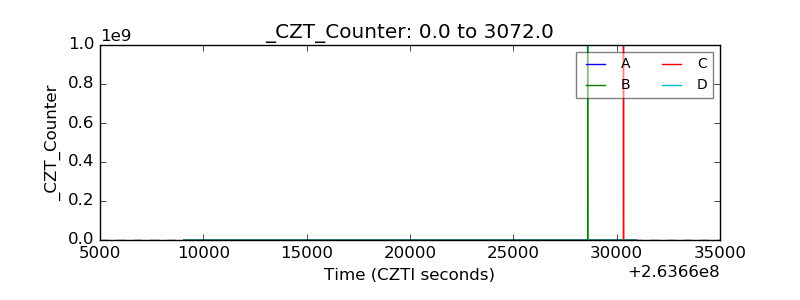 |
| +2.5 Volts monitor |  |
| +5 Volts monitor |  |
| _ROLL_ROT | 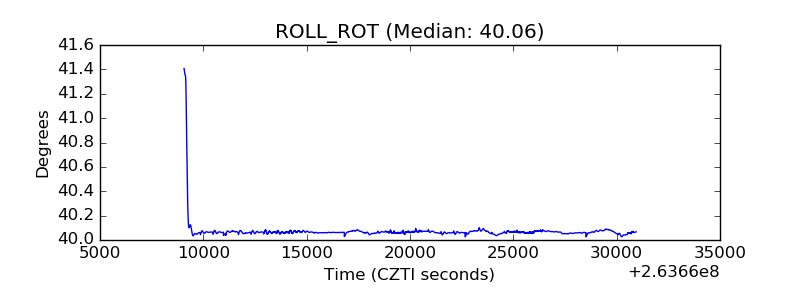 |
| _Roll_DEC |  |
| _Roll_RA |  |
| Veto Counter |  |