| Param | Original file | Final file |
|---|---|---|
| Filename | modeM0/AS1G08_033T01_9000002084cztM0_level2_bc.evt | modeM0/AS1G08_033T01_9000002084cztM0_level2_quad_clean.evt |
| Size (bytes) | 622,221,120 | 233,038,080 |
| Size | 593.4 MB | 222.2 MB |
| Events in quadrant A | 3,368,706 | 1,589,119 |
| Events in quadrant B | 4,419,226 | 1,544,633 |
| Events in quadrant C | 3,397,250 | 1,504,493 |
| Events in quadrant D | 6,669,163 | 1,423,077 |
| Mode M0 | |||
|---|---|---|---|
| Quadrant | BADHDUFLAG | Total packets | Discarded packets |
| A | 0 | 30735 | 0 |
| B | 0 | 35944 | 0 |
| C | 0 | 30362 | 0 |
| D | 0 | 41624 | 0 |
| Mode M9 | |||
|---|---|---|---|
| Quadrant | BADHDUFLAG | Total packets | Discarded packets |
| A | 0 | 29 | 0 |
| B | 0 | 29 | 0 |
| C | 0 | 29 | 0 |
| D | 0 | 29 | 0 |
| Mode SS | |||
|---|---|---|---|
| Quadrant | BADHDUFLAG | Total packets | Discarded packets |
| A | 0 | 292 | 0 |
| B | 0 | 292 | 0 |
| C | 0 | 292 | 0 |
| D | 0 | 292 | 0 |
| Quadrant | Total seconds | Saturated seconds | Saturation percentage |
|---|---|---|---|
| A | 14454 | 190 | 1.314515% |
| B | 14454 | 756 | 5.230386% |
| C | 14454 | 79 | 0.546562% |
| D | 14454 | 668 | 4.621558% |
Noise dominated data is calculated using 1-second bins in cleaned event files. If a bin has >2000 counts, and if more than 50% of those come from <1% of pixels, then it is considered to be noise-dominated and hence unusable.
| Quadrant | # 1 sec bins | Bins with >0 counts | Bins with >2000 counts | High rate bins dominated by noise | Noise dominated (total time) | Noise dominated (detector-on time) | Marked lightcurve |
|---|---|---|---|---|---|---|---|
| A | 17235 | 14456 | 0 | 0 | 0.00% | 0.00% |  |
| B | 17235 | 14454 | 54 | 54 | 0.31% | 0.37% |  |
| C | 17235 | 14456 | 0 | 0 | 0.00% | 0.00% |  |
| D | 17235 | 14455 | 87 | 87 | 0.50% | 0.60% |  |
Top three noisy pixels from each quadrant. If the there are fewer than three noisy pixels in the level2.evt file, extra rows are filled as -1
| Pixel properties | Quadrant properties | ||||||
|---|---|---|---|---|---|---|---|
| Quadrant | DetID | PixID | Counts | Sigma | Mean | Median | Sigma |
| A | 12 | 189 | 232780 | 1335.18 | 788 | 774 | 173.8 |
| A | 12 | 96 | 43752 | 247.34 | 788 | 774 | 173.8 |
| A | 9 | 143 | 39870 | 225.0 | 788 | 774 | 173.8 |
| B | 0 | 85 | 1009772 | 6703.51 | 772 | 754 | 150.5 |
| B | 0 | 189 | 113488 | 748.96 | 772 | 754 | 150.5 |
| B | 10 | 244 | 98971 | 652.51 | 772 | 754 | 150.5 |
| C | 3 | 233 | 423677 | 2511.2 | 750 | 742 | 168.4 |
| C | 14 | 220 | 12378 | 69.09 | 750 | 742 | 168.4 |
| C | 8 | 128 | 10989 | 60.84 | 750 | 742 | 168.4 |
| D | 1 | 52 | 1707034 | 9526.9 | 734 | 714 | 179.1 |
| D | 8 | 195 | 1181313 | 6591.64 | 734 | 714 | 179.1 |
| D | 7 | 80 | 537158 | 2995.13 | 734 | 714 | 179.1 |
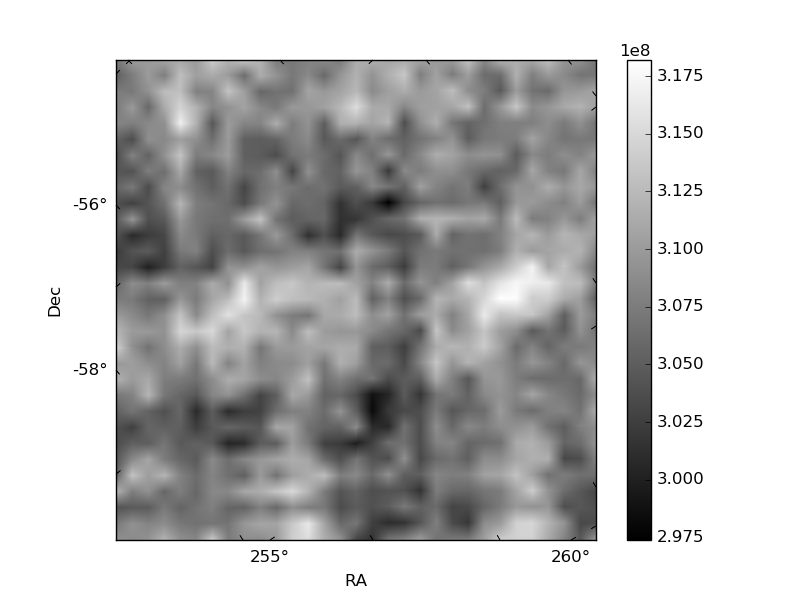
Histogram calculated using DETX and DETY for each event in the final _common_clean file
| Quadrant A |  |
 |
Quadrant B |
|---|---|---|---|
| Quadrant D |  |
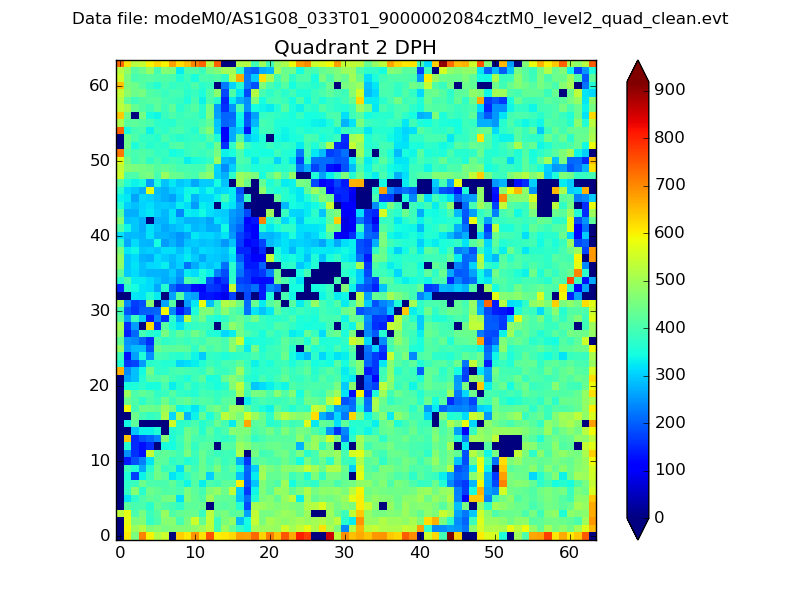 |
Quadrant C |
| Plot type | Count rate plots | Images |
|---|---|---|
| Comparison with Poisson distribution Blue bars denote a histogram of data divided into 1 sec bins. Red curve is a Poisson curve with rate = median count rate of data. |
 |
 |
| Quadrant-wise count rates Data is divided into 100 sec bins |
 |
|
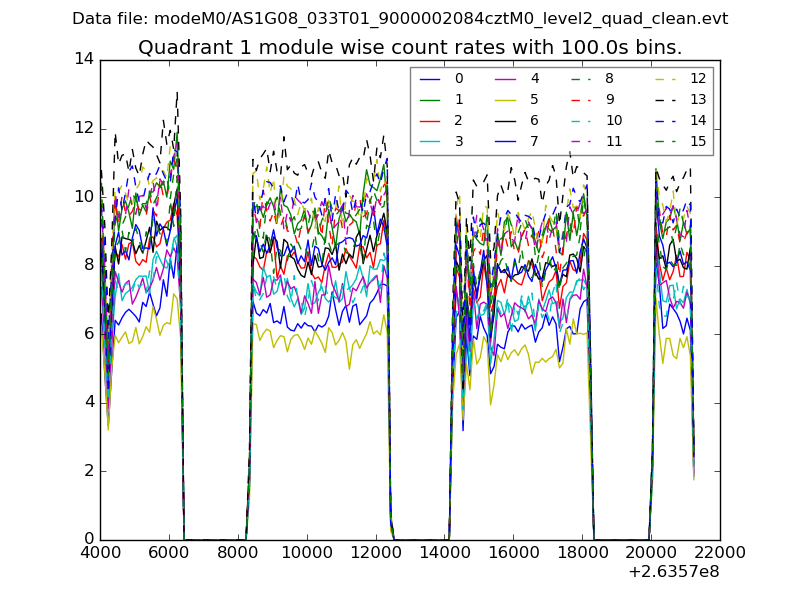
| Module-wise count rates for Quadrant A Data is divided into 100 sec bins |
 |
 |
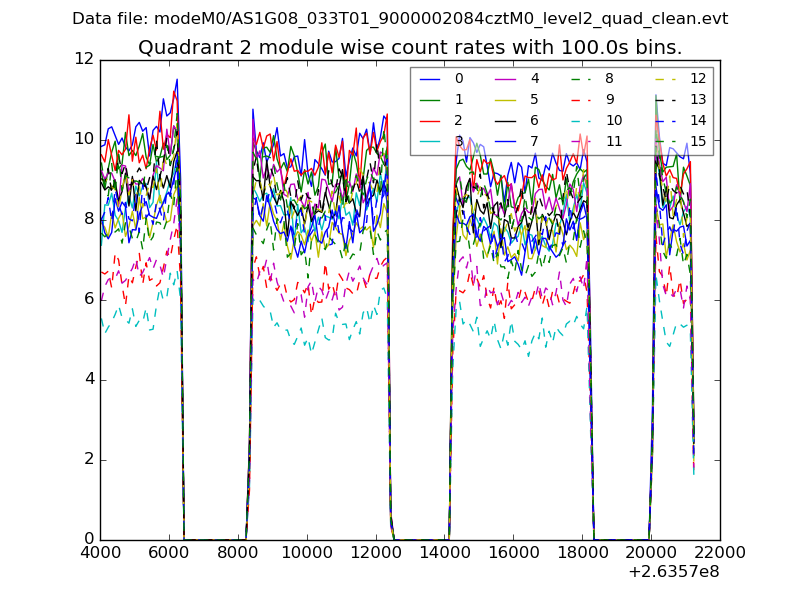
| Module-wise count rates for Quadrant B Data is divided into 100 sec bins |
 |
 |
| Module-wise count rates for Quadrant C Data is divided into 100 sec bins |
 |
 |
| Module-wise count rates for Quadrant D Data is divided into 100 sec bins |
 |
 |
| Parameter | Plot |
|---|---|
| CZT HV Monitor | 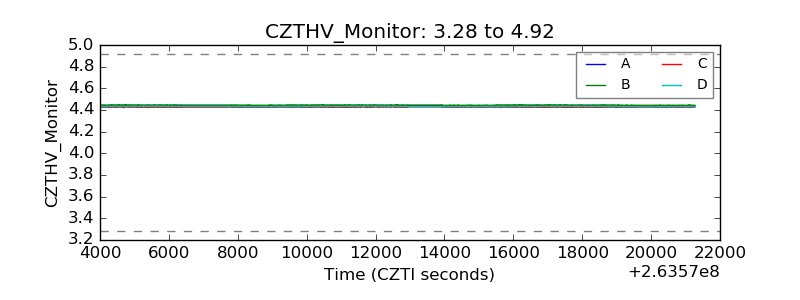 |
| D_VDD |  |
| Temperature 1 |  |
| Veto HV Monitor | 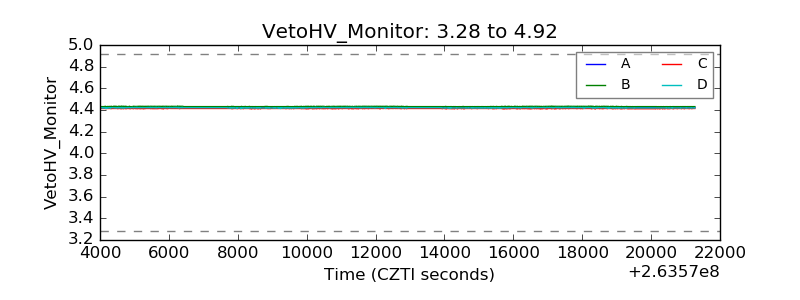 |
| Veto LLD |  |
| Alpha Counter |  |
| _CPM_Rate |  |
| CZT Counter |  |
| +2.5 Volts monitor | 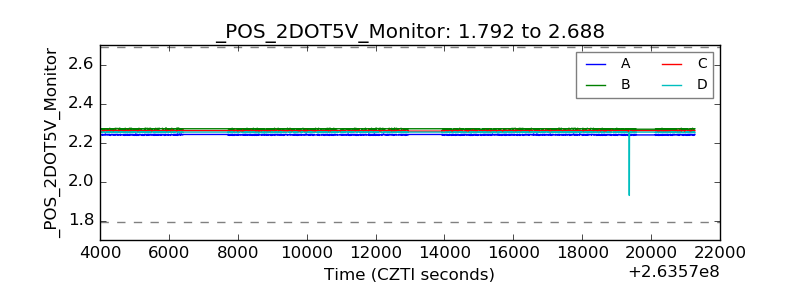 |
| +5 Volts monitor | 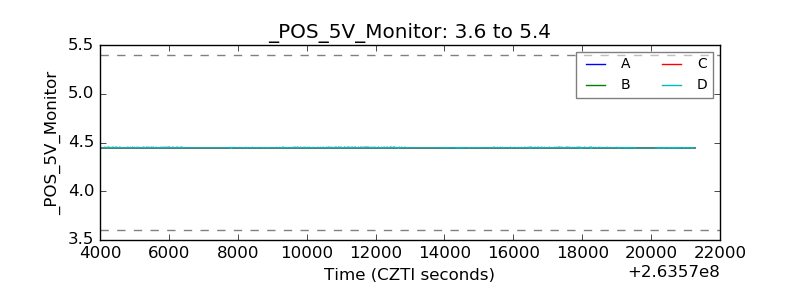 |
| _ROLL_ROT |  |
| _Roll_DEC | 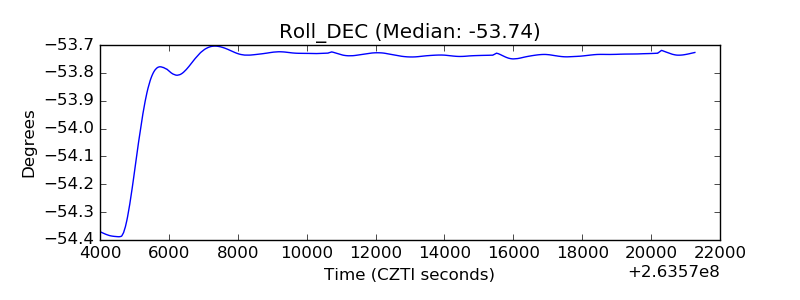 |
| _Roll_RA |  |
| Veto Counter |  |