| Param | Original file | Final file |
|---|---|---|
| Filename | modeM0/AS1A04_218T04_9000002086cztM0_level2_bc.evt | modeM0/AS1A04_218T04_9000002086cztM0_level2_quad_clean.evt |
| Size (bytes) | 2,687,169,600 | 831,545,280 |
| Size | 2.5 GB | 793.0 MB |
| Events in quadrant A | 13,645,760 | 5,259,266 |
| Events in quadrant B | 14,586,158 | 5,246,592 |
| Events in quadrant C | 15,789,126 | 5,384,574 |
| Events in quadrant D | 33,017,748 | 4,921,613 |
| Mode M0 | |||
|---|---|---|---|
| Quadrant | BADHDUFLAG | Total packets | Discarded packets |
| A | 0 | 133560 | 0 |
| B | 0 | 137169 | 0 |
| C | 0 | 136201 | 0 |
| D | 0 | 200624 | 0 |
| Mode SS | |||
|---|---|---|---|
| Quadrant | BADHDUFLAG | Total packets | Discarded packets |
| A | 0 | 1296 | 0 |
| B | 0 | 1296 | 0 |
| C | 0 | 1296 | 0 |
| D | 0 | 1296 | 0 |
| Mode M9 | |||
|---|---|---|---|
| Quadrant | BADHDUFLAG | Total packets | Discarded packets |
| A | 0 | 94 | 0 |
| B | 0 | 94 | 0 |
| C | 0 | 96 | 0 |
| D | 0 | 96 | 0 |
| Quadrant | Total seconds | Saturated seconds | Saturation percentage |
|---|---|---|---|
| A | 63784 | 775 | 1.215038% |
| B | 63786 | 940 | 1.473678% |
| C | 63779 | 612 | 0.959563% |
| D | 63781 | 5633 | 8.831784% |
Noise dominated data is calculated using 1-second bins in cleaned event files. If a bin has >2000 counts, and if more than 50% of those come from <1% of pixels, then it is considered to be noise-dominated and hence unusable.
| Quadrant | # 1 sec bins | Bins with >0 counts | Bins with >2000 counts | High rate bins dominated by noise | Noise dominated (total time) | Noise dominated (detector-on time) | Marked lightcurve |
|---|---|---|---|---|---|---|---|
| A | 76151 | 63808 | 8 | 8 | 0.01% | 0.01% |  |
| B | 76151 | 63809 | 3 | 3 | 0.00% | 0.00% |  |
| C | 76151 | 63807 | 1 | 1 | 0.00% | 0.00% |  |
| D | 76151 | 63800 | 1655 | 1655 | 2.17% | 2.59% |  |
Top three noisy pixels from each quadrant. If the there are fewer than three noisy pixels in the level2.evt file, extra rows are filled as -1
| Pixel properties | Quadrant properties | ||||||
|---|---|---|---|---|---|---|---|
| Quadrant | DetID | PixID | Counts | Sigma | Mean | Median | Sigma |
| A | 12 | 189 | 284728 | 381.5 | 3396 | 3336 | 737.6 |
| A | 8 | 15 | 106575 | 139.97 | 3396 | 3336 | 737.6 |
| A | 11 | 29 | 55673 | 70.96 | 3396 | 3336 | 737.6 |
| B | 10 | 244 | 474651 | 743.59 | 3394 | 3303 | 633.9 |
| B | 0 | 189 | 276364 | 430.77 | 3394 | 3303 | 633.9 |
| B | 3 | 209 | 209980 | 326.05 | 3394 | 3303 | 633.9 |
| C | 3 | 233 | 2583386 | 3417.88 | 3352 | 3295 | 754.9 |
| C | 14 | 234 | 55024 | 68.53 | 3352 | 3295 | 754.9 |
| C | 10 | 22 | 32568 | 38.78 | 3352 | 3295 | 754.9 |
| D | 7 | 80 | 11680507 | 15576.65 | 3230 | 3130 | 749.7 |
| D | 8 | 195 | 3386195 | 4512.73 | 3230 | 3130 | 749.7 |
| D | 1 | 52 | 2541878 | 3386.48 | 3230 | 3130 | 749.7 |
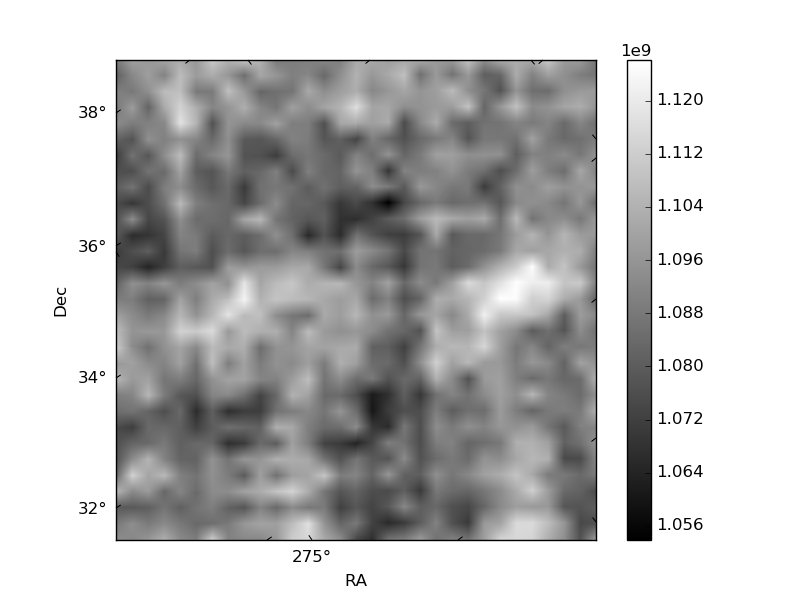
Histogram calculated using DETX and DETY for each event in the final _common_clean file
| Quadrant A |  |
 |
Quadrant B |
|---|---|---|---|
| Quadrant D |  |
 |
Quadrant C |
| Plot type | Count rate plots | Images |
|---|---|---|
| Comparison with Poisson distribution Blue bars denote a histogram of data divided into 1 sec bins. Red curve is a Poisson curve with rate = median count rate of data. |
 |
 |
| Quadrant-wise count rates Data is divided into 100 sec bins |
 |
|
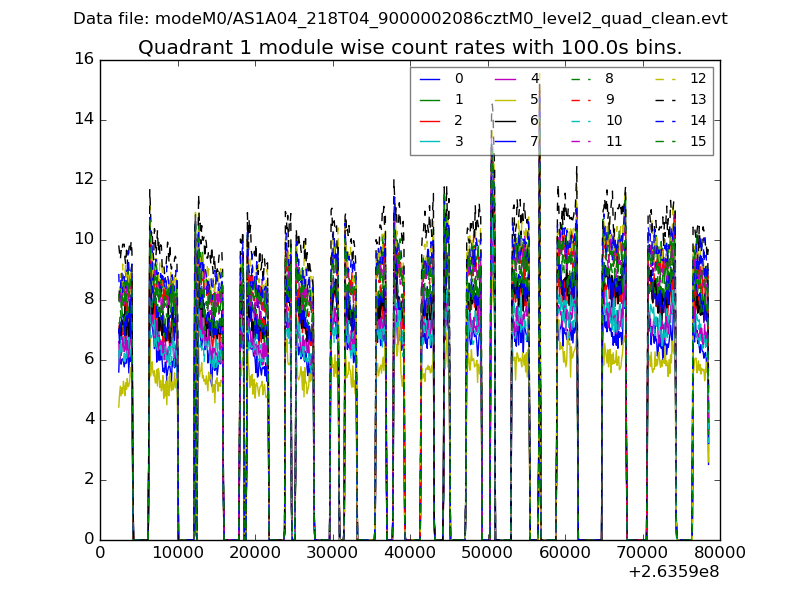
| Module-wise count rates for Quadrant A Data is divided into 100 sec bins |
 |
 |
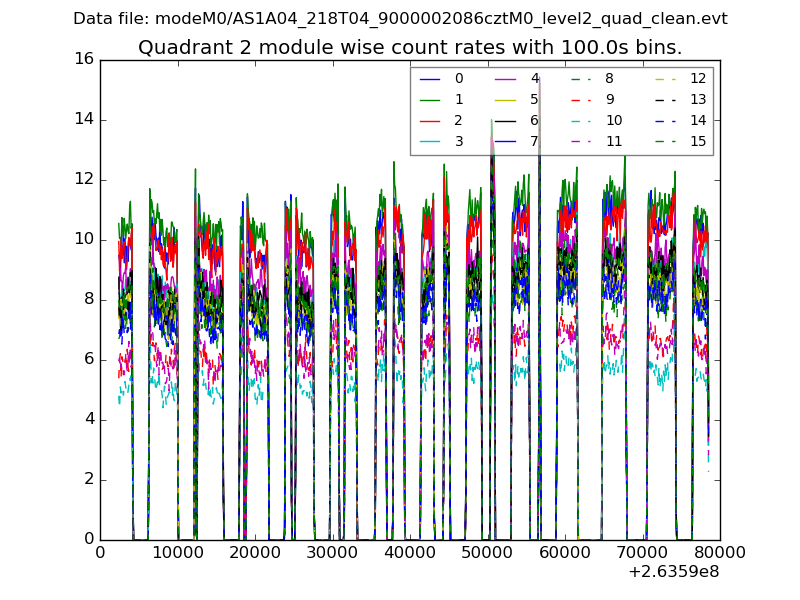
| Module-wise count rates for Quadrant B Data is divided into 100 sec bins |
 |
 |
| Module-wise count rates for Quadrant C Data is divided into 100 sec bins |
 |
 |
| Module-wise count rates for Quadrant D Data is divided into 100 sec bins |
 |
 |
| Parameter | Plot |
|---|---|
| CZT HV Monitor |  |
| D_VDD |  |
| Temperature 1 | 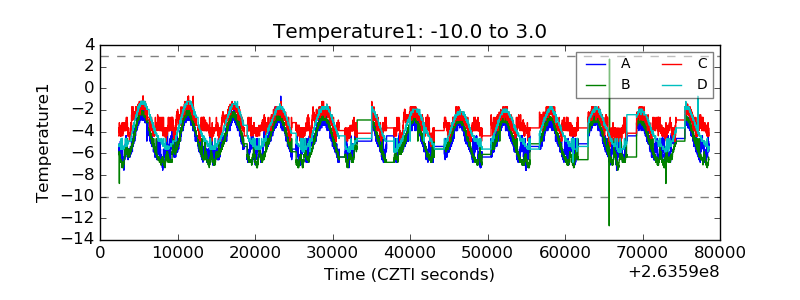 |
| Veto HV Monitor |  |
| Veto LLD |  |
| Alpha Counter |  |
| _CPM_Rate |  |
| CZT Counter | 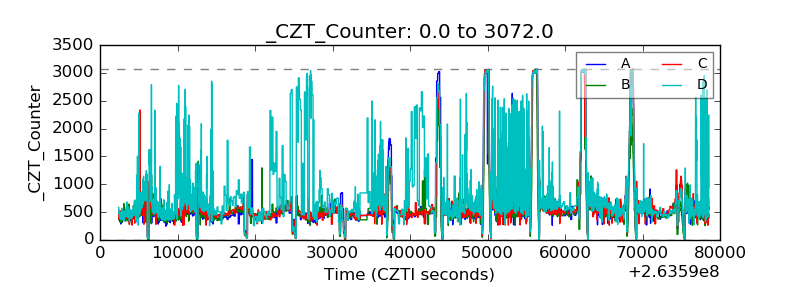 |
| +2.5 Volts monitor |  |
| +5 Volts monitor |  |
| _ROLL_ROT |  |
| _Roll_DEC |  |
| _Roll_RA |  |
| Veto Counter | 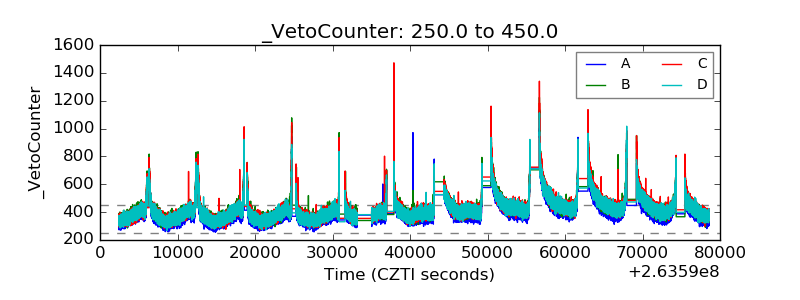 |