| Param | Original file | Final file |
|---|---|---|
| Filename | modeM0/AS1G08_028T01_9000002080cztM0_level2_bc.evt | modeM0/AS1G08_028T01_9000002080cztM0_level2_quad_clean.evt |
| Size (bytes) | 1,333,656,000 | 480,248,640 |
| Size | 1.2 GB | 458.0 MB |
| Events in quadrant A | 8,260,550 | 3,050,100 |
| Events in quadrant B | 9,511,176 | 3,036,939 |
| Events in quadrant C | 8,799,334 | 3,002,559 |
| Events in quadrant D | 11,300,609 | 2,921,911 |
| Mode M0 | |||
|---|---|---|---|
| Quadrant | BADHDUFLAG | Total packets | Discarded packets |
| A | 0 | 78116 | 0 |
| B | 0 | 82579 | 0 |
| C | 0 | 78195 | 0 |
| D | 0 | 87585 | 0 |
| Mode SS | |||
|---|---|---|---|
| Quadrant | BADHDUFLAG | Total packets | Discarded packets |
| A | 0 | 750 | 0 |
| B | 0 | 750 | 0 |
| C | 0 | 750 | 0 |
| D | 0 | 750 | 0 |
| Mode M9 | |||
|---|---|---|---|
| Quadrant | BADHDUFLAG | Total packets | Discarded packets |
| A | 0 | 85 | 0 |
| B | 0 | 85 | 0 |
| C | 0 | 85 | 0 |
| D | 0 | 85 | 0 |
| Quadrant | Total seconds | Saturated seconds | Saturation percentage |
|---|---|---|---|
| A | 36913 | 449 | 1.216374% |
| B | 36913 | 679 | 1.839460% |
| C | 36913 | 316 | 0.856067% |
| D | 36913 | 765 | 2.072441% |
Noise dominated data is calculated using 1-second bins in cleaned event files. If a bin has >2000 counts, and if more than 50% of those come from <1% of pixels, then it is considered to be noise-dominated and hence unusable.
| Quadrant | # 1 sec bins | Bins with >0 counts | Bins with >2000 counts | High rate bins dominated by noise | Noise dominated (total time) | Noise dominated (detector-on time) | Marked lightcurve |
|---|---|---|---|---|---|---|---|
| A | 45178 | 36915 | 0 | 0 | 0.00% | 0.00% | 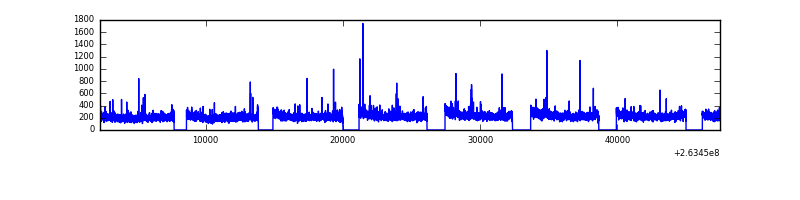 |
| B | 45178 | 36913 | 49 | 49 | 0.11% | 0.13% |  |
| C | 45178 | 36915 | 0 | 0 | 0.00% | 0.00% |  |
| D | 45178 | 36915 | 109 | 109 | 0.24% | 0.30% |  |
Top three noisy pixels from each quadrant. If the there are fewer than three noisy pixels in the level2.evt file, extra rows are filled as -1
| Pixel properties | Quadrant properties | ||||||
|---|---|---|---|---|---|---|---|
| Quadrant | DetID | PixID | Counts | Sigma | Mean | Median | Sigma |
| A | 8 | 15 | 63040 | 134.92 | 2113 | 2079 | 451.8 |
| A | 12 | 96 | 32305 | 66.9 | 2113 | 2079 | 451.8 |
| A | 15 | 222 | 30684 | 63.31 | 2113 | 2079 | 451.8 |
| B | 0 | 85 | 374349 | 958.15 | 2109 | 2067 | 388.5 |
| B | 10 | 16 | 361666 | 925.5 | 2109 | 2067 | 388.5 |
| B | 0 | 189 | 228921 | 583.86 | 2109 | 2067 | 388.5 |
| C | 3 | 233 | 684652 | 1544.09 | 2052 | 2039 | 442.1 |
| C | 14 | 234 | 25514 | 53.1 | 2052 | 2039 | 442.1 |
| C | 0 | 207 | 20021 | 40.68 | 2052 | 2039 | 442.1 |
| D | 10 | 157 | 1716027 | 3660.72 | 2054 | 2006 | 468.2 |
| D | 1 | 52 | 804245 | 1713.38 | 2054 | 2006 | 468.2 |
| D | 2 | 152 | 295564 | 626.97 | 2054 | 2006 | 468.2 |
Histogram calculated using DETX and DETY for each event in the final _common_clean file
| Quadrant A | 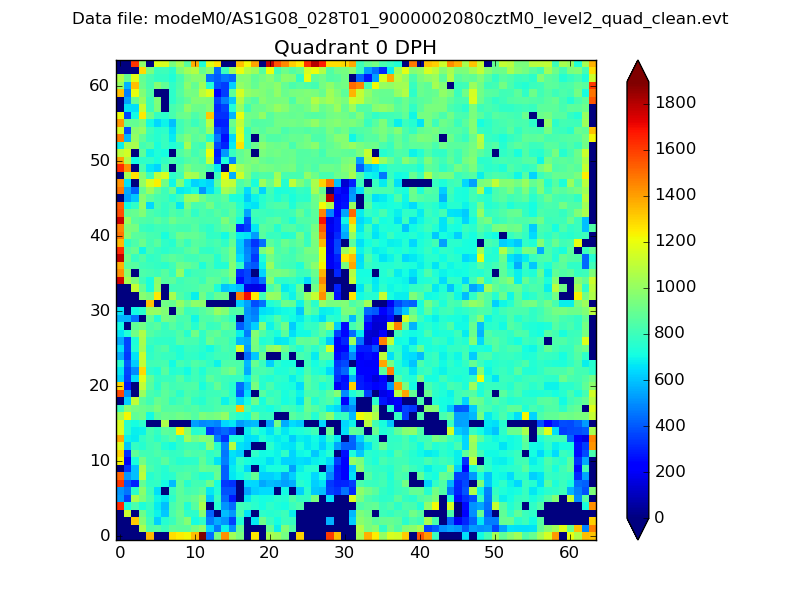 |
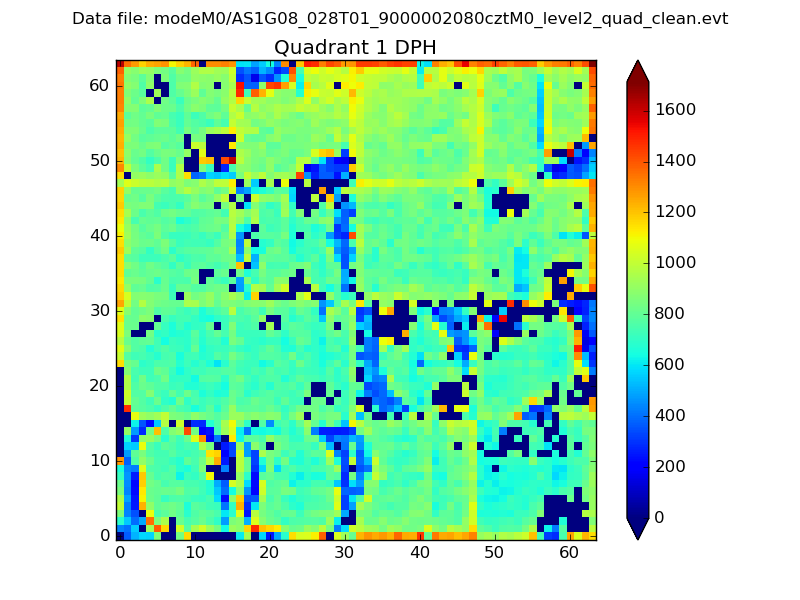 |
Quadrant B |
|---|---|---|---|
| Quadrant D |  |
 |
Quadrant C |
| Plot type | Count rate plots | Images |
|---|---|---|
| Comparison with Poisson distribution Blue bars denote a histogram of data divided into 1 sec bins. Red curve is a Poisson curve with rate = median count rate of data. |
 |
 |
| Quadrant-wise count rates Data is divided into 100 sec bins |
 |
|
| Module-wise count rates for Quadrant A Data is divided into 100 sec bins |
 |
 |
| Module-wise count rates for Quadrant B Data is divided into 100 sec bins |
 |
 |
| Module-wise count rates for Quadrant C Data is divided into 100 sec bins |
 |
 |
| Module-wise count rates for Quadrant D Data is divided into 100 sec bins |
 |
 |
| Parameter | Plot |
|---|---|
| CZT HV Monitor |  |
| D_VDD |  |
| Temperature 1 |  |
| Veto HV Monitor |  |
| Veto LLD |  |
| Alpha Counter |  |
| _CPM_Rate | 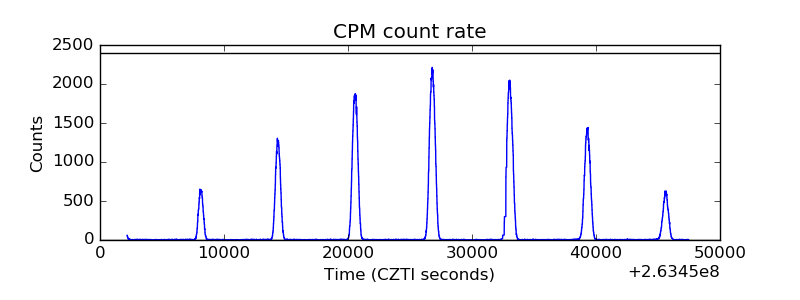 |
| CZT Counter | 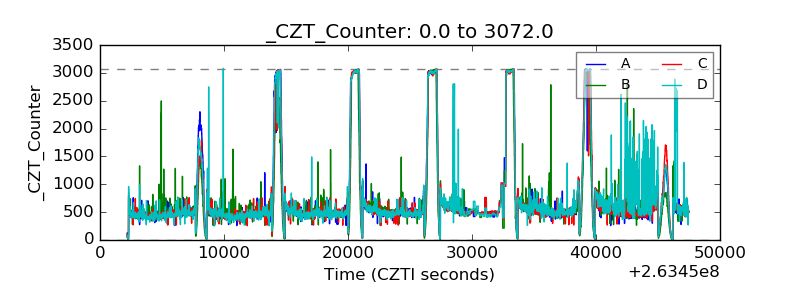 |
| +2.5 Volts monitor |  |
| +5 Volts monitor |  |
| _ROLL_ROT |  |
| _Roll_DEC | 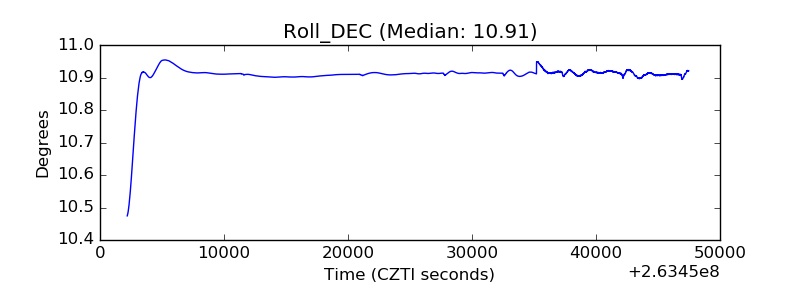 |
| _Roll_RA |  |
| Veto Counter | 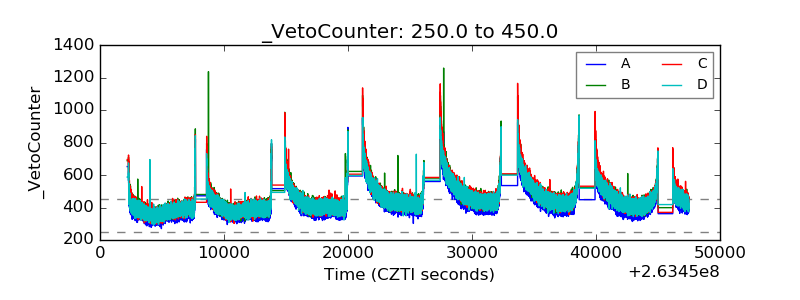 |