| Param | Original file | Final file |
|---|---|---|
| Filename | modeM0/AS1A04_149T01_9000002082cztM0_level2_bc.evt | modeM0/AS1A04_149T01_9000002082cztM0_level2_quad_clean.evt |
| Size (bytes) | 2,524,824,000 | 1,123,320,960 |
| Size | 2.4 GB | 1.0 GB |
| Events in quadrant A | 14,091,787 | 7,593,676 |
| Events in quadrant B | 22,107,098 | 7,372,809 |
| Events in quadrant C | 15,350,261 | 7,420,198 |
| Events in quadrant D | 20,478,290 | 7,174,050 |
| Mode SS | |||
|---|---|---|---|
| Quadrant | BADHDUFLAG | Total packets | Discarded packets |
| A | 0 | 1324 | 0 |
| B | 0 | 1324 | 0 |
| C | 0 | 1324 | 0 |
| D | 0 | 1324 | 0 |
| Mode M0 | |||
|---|---|---|---|
| Quadrant | BADHDUFLAG | Total packets | Discarded packets |
| A | 0 | 135866 | 0 |
| B | 0 | 173691 | 0 |
| C | 0 | 136347 | 0 |
| D | 0 | 154484 | 0 |
| Mode M9 | |||
|---|---|---|---|
| Quadrant | BADHDUFLAG | Total packets | Discarded packets |
| A | 0 | 97 | 0 |
| B | 0 | 97 | 0 |
| C | 0 | 97 | 0 |
| D | 0 | 97 | 0 |
| Quadrant | Total seconds | Saturated seconds | Saturation percentage |
|---|---|---|---|
| A | 65120 | 657 | 1.008907% |
| B | 65120 | 5129 | 7.876229% |
| C | 65120 | 549 | 0.843059% |
| D | 65120 | 1304 | 2.002457% |
Noise dominated data is calculated using 1-second bins in cleaned event files. If a bin has >2000 counts, and if more than 50% of those come from <1% of pixels, then it is considered to be noise-dominated and hence unusable.
| Quadrant | # 1 sec bins | Bins with >0 counts | Bins with >2000 counts | High rate bins dominated by noise | Noise dominated (total time) | Noise dominated (detector-on time) | Marked lightcurve |
|---|---|---|---|---|---|---|---|
| A | 74751 | 65124 | 7 | 7 | 0.01% | 0.01% | 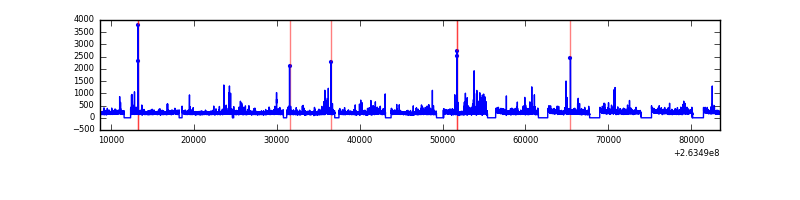 |
| B | 74751 | 65113 | 373 | 373 | 0.50% | 0.57% |  |
| C | 74751 | 65124 | 1 | 1 | 0.00% | 0.00% |  |
| D | 74751 | 65124 | 252 | 252 | 0.34% | 0.39% |  |
Top three noisy pixels from each quadrant. If the there are fewer than three noisy pixels in the level2.evt file, extra rows are filled as -1
| Pixel properties | Quadrant properties | ||||||
|---|---|---|---|---|---|---|---|
| Quadrant | DetID | PixID | Counts | Sigma | Mean | Median | Sigma |
| A | 12 | 189 | 540284 | 709.73 | 3445 | 3385 | 756.5 |
| A | 12 | 96 | 132294 | 170.41 | 3445 | 3385 | 756.5 |
| A | 8 | 15 | 96690 | 123.34 | 3445 | 3385 | 756.5 |
| B | 0 | 85 | 6909413 | 10889.19 | 3346 | 3266 | 634.2 |
| B | 0 | 189 | 737676 | 1157.97 | 3346 | 3266 | 634.2 |
| B | 10 | 16 | 500281 | 783.66 | 3346 | 3266 | 634.2 |
| C | 3 | 233 | 2146874 | 2915.7 | 3325 | 3291 | 735.2 |
| C | 0 | 207 | 81767 | 106.74 | 3325 | 3291 | 735.2 |
| C | 10 | 22 | 58691 | 75.35 | 3325 | 3291 | 735.2 |
| D | 1 | 52 | 2866800 | 3633.85 | 3330 | 3236 | 788.0 |
| D | 8 | 195 | 1522906 | 1928.46 | 3330 | 3236 | 788.0 |
| D | 10 | 157 | 1202904 | 1522.37 | 3330 | 3236 | 788.0 |
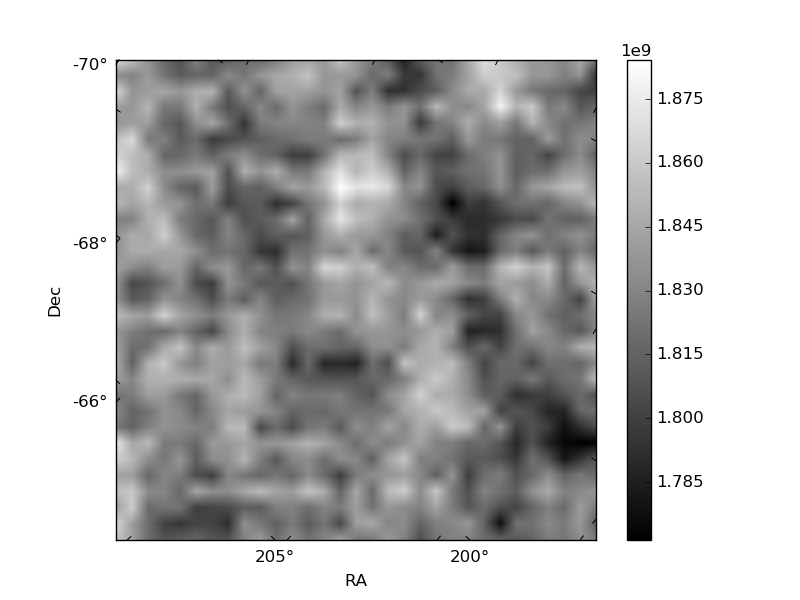
Histogram calculated using DETX and DETY for each event in the final _common_clean file
| Quadrant A | 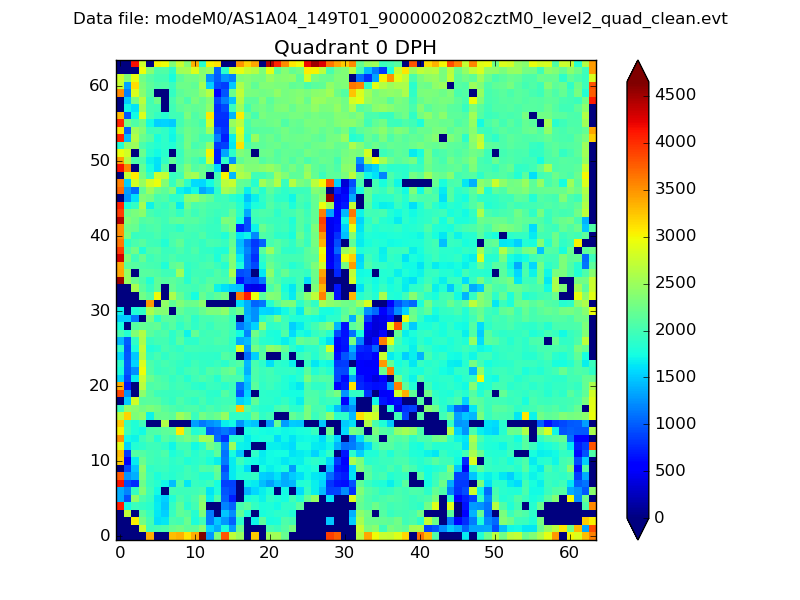 |
 |
Quadrant B |
|---|---|---|---|
| Quadrant D | 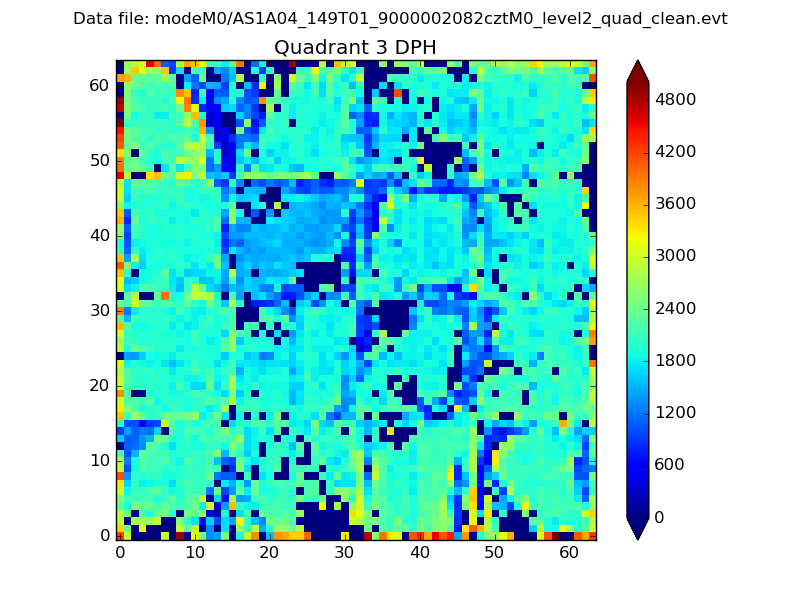 |
 |
Quadrant C |
| Plot type | Count rate plots | Images |
|---|---|---|
| Comparison with Poisson distribution Blue bars denote a histogram of data divided into 1 sec bins. Red curve is a Poisson curve with rate = median count rate of data. |
 |
 |
| Quadrant-wise count rates Data is divided into 100 sec bins |
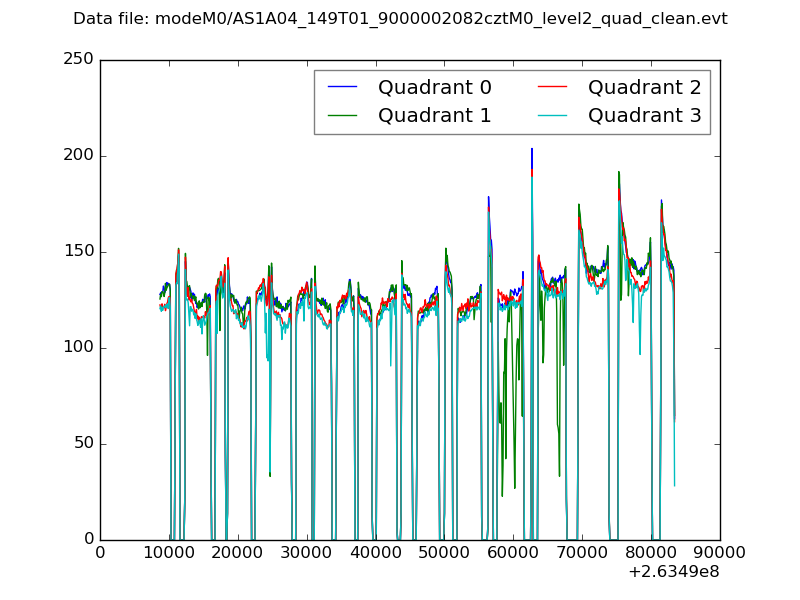 |
|
| Module-wise count rates for Quadrant A Data is divided into 100 sec bins |
 |
 |
| Module-wise count rates for Quadrant B Data is divided into 100 sec bins |
 |
 |
| Module-wise count rates for Quadrant C Data is divided into 100 sec bins |
 |
 |
| Module-wise count rates for Quadrant D Data is divided into 100 sec bins |
 |
 |
| Parameter | Plot |
|---|---|
| CZT HV Monitor |  |
| D_VDD |  |
| Temperature 1 |  |
| Veto HV Monitor | 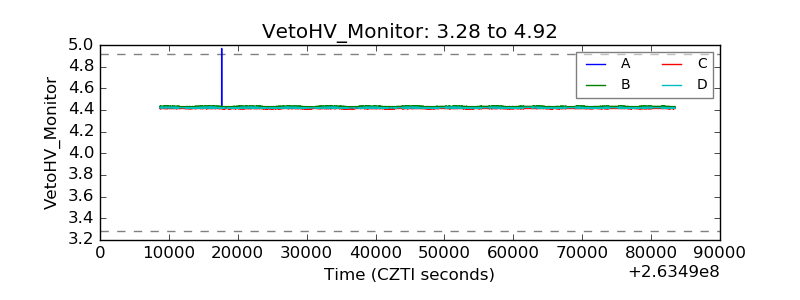 |
| Veto LLD |  |
| Alpha Counter |  |
| _CPM_Rate |  |
| CZT Counter |  |
| +2.5 Volts monitor |  |
| +5 Volts monitor | 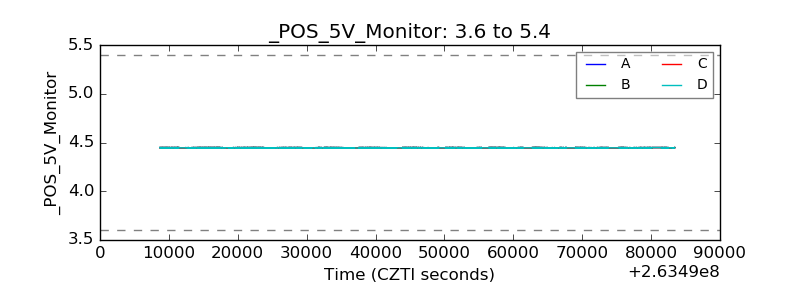 |
| _ROLL_ROT |  |
| _Roll_DEC |  |
| _Roll_RA |  |
| Veto Counter |  |