| Param | Original file | Final file |
|---|---|---|
| Filename | modeM0/AS1A04_162T01_9000002074cztM0_level2_bc.evt | modeM0/AS1A04_162T01_9000002074cztM0_level2_quad_clean.evt |
| Size (bytes) | 5,244,788,160 | 2,364,508,800 |
| Size | 4.9 GB | 2.2 GB |
| Events in quadrant A | 28,154,541 | 16,292,837 |
| Events in quadrant B | 32,502,584 | 16,460,306 |
| Events in quadrant C | 28,336,956 | 15,831,480 |
| Events in quadrant D | 61,367,301 | 14,503,747 |
| Mode SS | |||
|---|---|---|---|
| Quadrant | BADHDUFLAG | Total packets | Discarded packets |
| A | 0 | 2532 | 0 |
| B | 0 | 2532 | 0 |
| C | 0 | 2532 | 0 |
| D | 0 | 2532 | 0 |
| Mode M0 | |||
|---|---|---|---|
| Quadrant | BADHDUFLAG | Total packets | Discarded packets |
| A | 0 | 262690 | 0 |
| B | 0 | 281360 | 0 |
| C | 0 | 260725 | 0 |
| D | 0 | 381001 | 0 |
| Mode M9 | |||
|---|---|---|---|
| Quadrant | BADHDUFLAG | Total packets | Discarded packets |
| A | 0 | 195 | 0 |
| B | 0 | 195 | 0 |
| C | 0 | 195 | 0 |
| D | 0 | 195 | 0 |
| Quadrant | Total seconds | Saturated seconds | Saturation percentage |
|---|---|---|---|
| A | 124579 | 1278 | 1.025855% |
| B | 124579 | 2598 | 2.085424% |
| C | 124579 | 1029 | 0.825982% |
| D | 124579 | 14369 | 11.534047% |
Noise dominated data is calculated using 1-second bins in cleaned event files. If a bin has >2000 counts, and if more than 50% of those come from <1% of pixels, then it is considered to be noise-dominated and hence unusable.
| Quadrant | # 1 sec bins | Bins with >0 counts | Bins with >2000 counts | High rate bins dominated by noise | Noise dominated (total time) | Noise dominated (detector-on time) | Marked lightcurve |
|---|---|---|---|---|---|---|---|
| A | 143025 | 124587 | 27 | 27 | 0.02% | 0.02% |  |
| B | 143025 | 124581 | 89 | 89 | 0.06% | 0.07% | 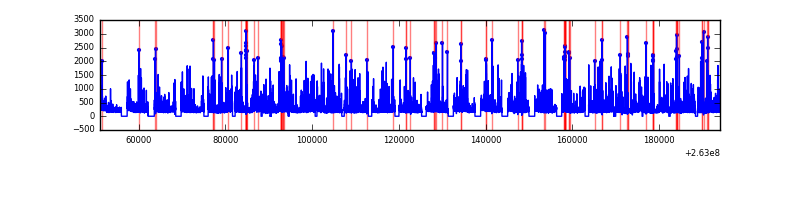 |
| C | 143025 | 124584 | 23 | 23 | 0.02% | 0.02% |  |
| D | 143025 | 124560 | 4460 | 4460 | 3.12% | 3.58% |  |
Top three noisy pixels from each quadrant. If the there are fewer than three noisy pixels in the level2.evt file, extra rows are filled as -1
| Pixel properties | Quadrant properties | ||||||
|---|---|---|---|---|---|---|---|
| Quadrant | DetID | PixID | Counts | Sigma | Mean | Median | Sigma |
| A | 12 | 189 | 1429101 | 998.45 | 6528 | 6423 | 1424.9 |
| A | 8 | 15 | 481663 | 333.53 | 6528 | 6423 | 1424.9 |
| A | 9 | 143 | 416912 | 288.08 | 6528 | 6423 | 1424.9 |
| B | 0 | 189 | 1653076 | 1315.34 | 6558 | 6396 | 1251.9 |
| B | 0 | 219 | 1409720 | 1120.95 | 6558 | 6396 | 1251.9 |
| B | 10 | 245 | 1223557 | 972.25 | 6558 | 6396 | 1251.9 |
| C | 3 | 233 | 3093690 | 2241.06 | 6263 | 6198 | 1377.7 |
| C | 0 | 207 | 552624 | 396.62 | 6263 | 6198 | 1377.7 |
| C | 14 | 220 | 74737 | 49.75 | 6263 | 6198 | 1377.7 |
| D | 1 | 52 | 24239885 | 15518.43 | 5974 | 5804 | 1561.6 |
| D | 8 | 195 | 4030513 | 2577.24 | 5974 | 5804 | 1561.6 |
| D | 12 | 110 | 2496395 | 1594.86 | 5974 | 5804 | 1561.6 |
Histogram calculated using DETX and DETY for each event in the final _common_clean file
| Quadrant A | 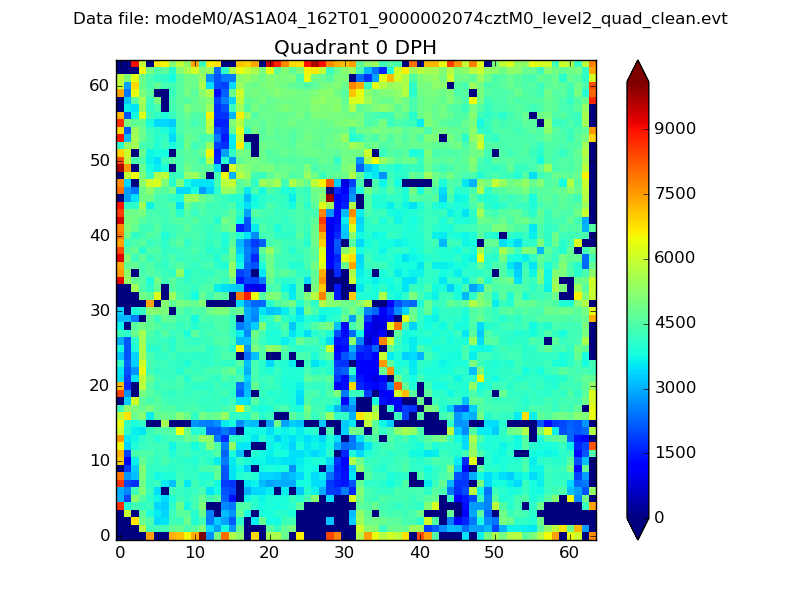 |
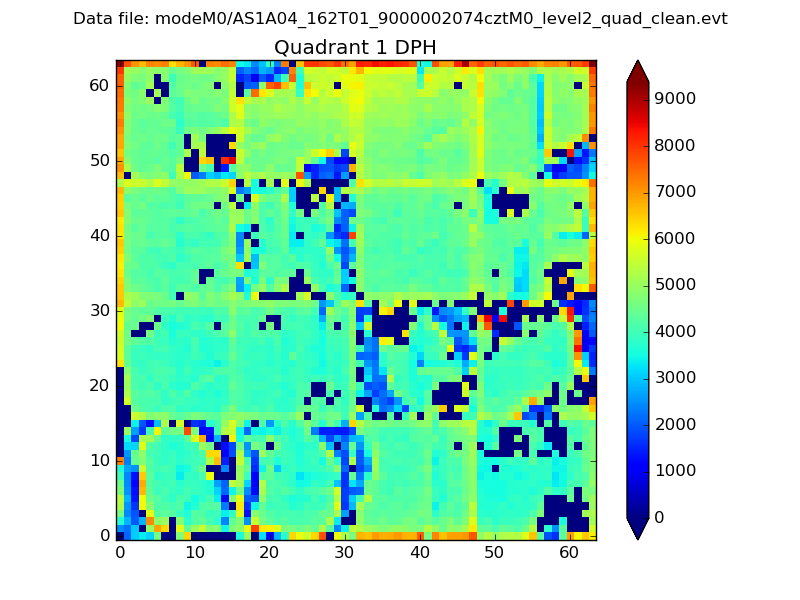 |
Quadrant B |
|---|---|---|---|
| Quadrant D |  |
 |
Quadrant C |
| Plot type | Count rate plots | Images |
|---|---|---|
| Comparison with Poisson distribution Blue bars denote a histogram of data divided into 1 sec bins. Red curve is a Poisson curve with rate = median count rate of data. |
 |
 |
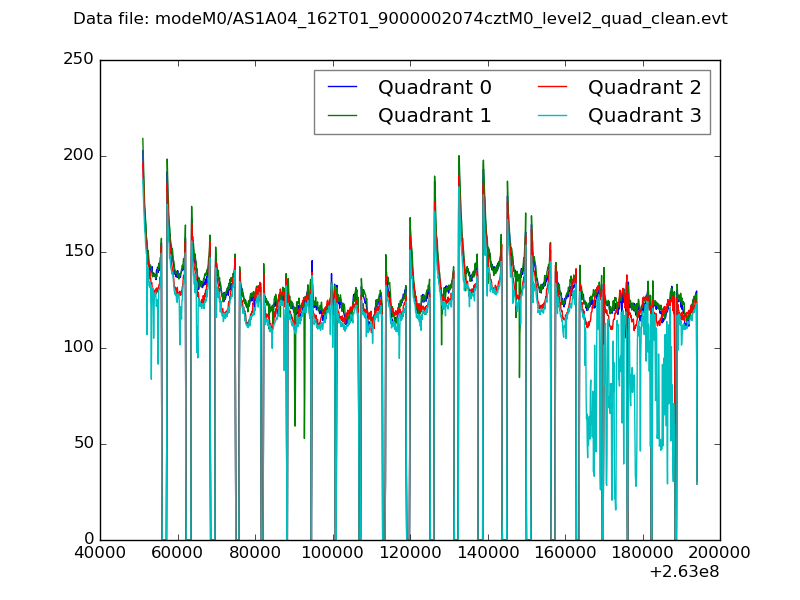
| Quadrant-wise count rates Data is divided into 100 sec bins |
 |
|
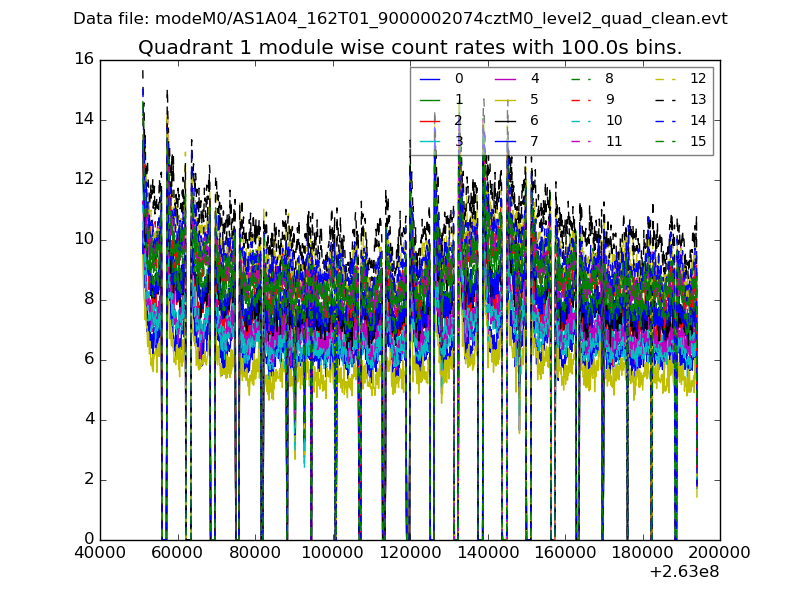
| Module-wise count rates for Quadrant A Data is divided into 100 sec bins |
 |
 |
| Module-wise count rates for Quadrant B Data is divided into 100 sec bins |
 |
 |
| Module-wise count rates for Quadrant C Data is divided into 100 sec bins |
 |
 |
| Module-wise count rates for Quadrant D Data is divided into 100 sec bins |
 |
 |
| Parameter | Plot |
|---|---|
| CZT HV Monitor | 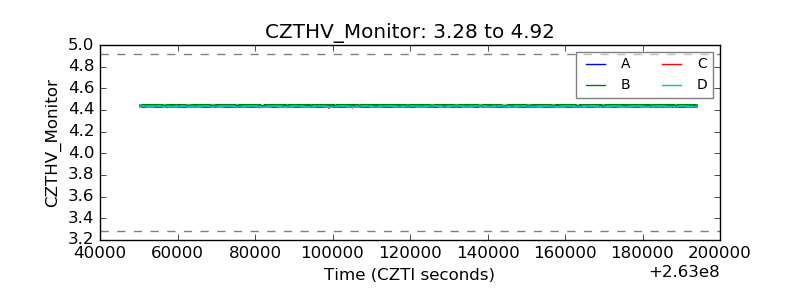 |
| D_VDD |  |
| Temperature 1 |  |
| Veto HV Monitor |  |
| Veto LLD | 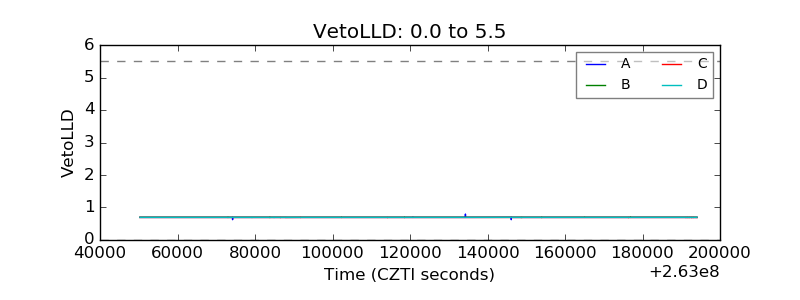 |
| Alpha Counter | 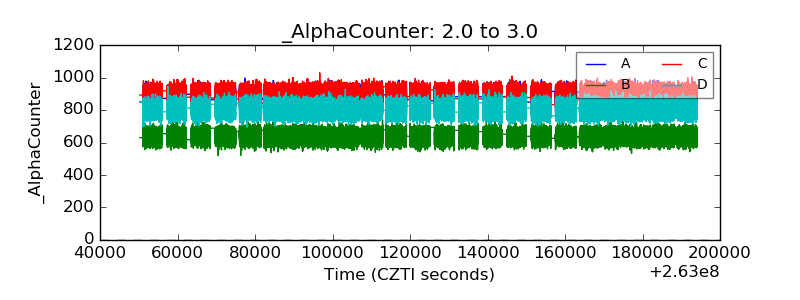 |
| _CPM_Rate |  |
| CZT Counter | 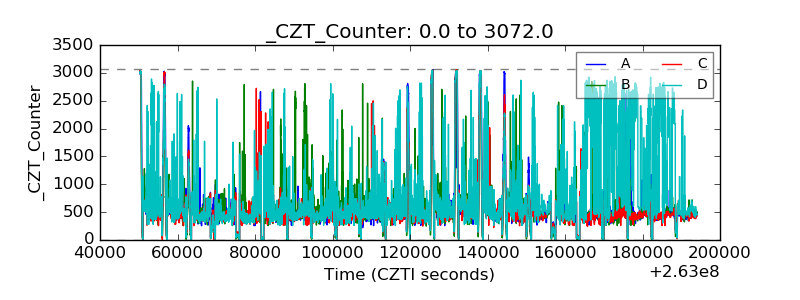 |
| +2.5 Volts monitor |  |
| +5 Volts monitor |  |
| _ROLL_ROT | 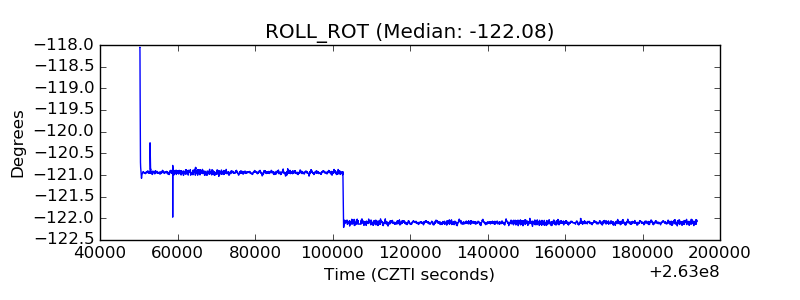 |
| _Roll_DEC |  |
| _Roll_RA |  |
| Veto Counter | 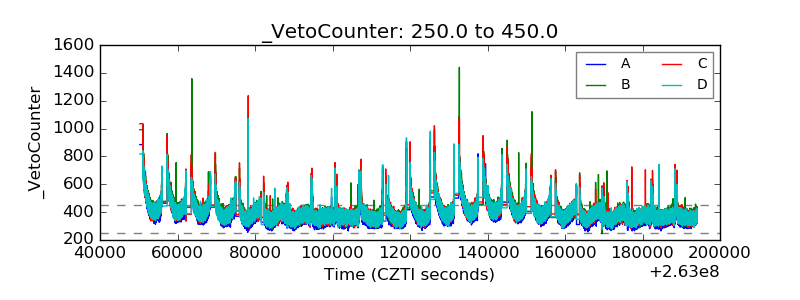 |