| Param | Original file | Final file |
|---|---|---|
| Filename | modeM0/AS1G08_002T01_9000002072cztM0_level2_bc.evt | modeM0/AS1G08_002T01_9000002072cztM0_level2_quad_clean.evt |
| Size (bytes) | 2,668,314,240 | 962,879,040 |
| Size | 2.5 GB | 918.3 MB |
| Events in quadrant A | 15,203,046 | 6,100,020 |
| Events in quadrant B | 15,677,812 | 6,142,720 |
| Events in quadrant C | 17,618,776 | 6,135,373 |
| Events in quadrant D | 27,425,390 | 5,869,551 |
| Mode M0 | |||
|---|---|---|---|
| Quadrant | BADHDUFLAG | Total packets | Discarded packets |
| A | 0 | 150138 | 0 |
| B | 0 | 151913 | 0 |
| C | 0 | 154195 | 0 |
| D | 0 | 189468 | 0 |
| Mode SS | |||
|---|---|---|---|
| Quadrant | BADHDUFLAG | Total packets | Discarded packets |
| A | 0 | 1458 | 0 |
| B | 0 | 1458 | 0 |
| C | 0 | 1458 | 0 |
| D | 0 | 1458 | 0 |
| Mode M9 | |||
|---|---|---|---|
| Quadrant | BADHDUFLAG | Total packets | Discarded packets |
| A | 0 | 113 | 0 |
| B | 0 | 113 | 0 |
| C | 0 | 113 | 0 |
| D | 0 | 113 | 0 |
| Quadrant | Total seconds | Saturated seconds | Saturation percentage |
|---|---|---|---|
| A | 71743 | 756 | 1.053761% |
| B | 71743 | 903 | 1.258659% |
| C | 71743 | 585 | 0.815411% |
| D | 71743 | 2128 | 2.966143% |
Noise dominated data is calculated using 1-second bins in cleaned event files. If a bin has >2000 counts, and if more than 50% of those come from <1% of pixels, then it is considered to be noise-dominated and hence unusable.
| Quadrant | # 1 sec bins | Bins with >0 counts | Bins with >2000 counts | High rate bins dominated by noise | Noise dominated (total time) | Noise dominated (detector-on time) | Marked lightcurve |
|---|---|---|---|---|---|---|---|
| A | 82769 | 71746 | 27 | 27 | 0.03% | 0.04% |  |
| B | 82769 | 71745 | 18 | 18 | 0.02% | 0.03% |  |
| C | 82769 | 71747 | 4 | 4 | 0.00% | 0.01% |  |
| D | 82769 | 71746 | 230 | 230 | 0.28% | 0.32% |  |
Top three noisy pixels from each quadrant. If the there are fewer than three noisy pixels in the level2.evt file, extra rows are filled as -1
| Pixel properties | Quadrant properties | ||||||
|---|---|---|---|---|---|---|---|
| Quadrant | DetID | PixID | Counts | Sigma | Mean | Median | Sigma |
| A | 12 | 189 | 372322 | 446.63 | 3775 | 3694 | 825.4 |
| A | 14 | 111 | 112711 | 132.08 | 3775 | 3694 | 825.4 |
| A | 1 | 162 | 96905 | 112.93 | 3775 | 3694 | 825.4 |
| B | 10 | 16 | 296965 | 414.82 | 3782 | 3683 | 707.0 |
| B | 3 | 209 | 155720 | 215.04 | 3782 | 3683 | 707.0 |
| B | 0 | 214 | 146559 | 202.09 | 3782 | 3683 | 707.0 |
| C | 3 | 233 | 2535350 | 3062.6 | 3738 | 3680 | 826.6 |
| C | 14 | 220 | 443185 | 531.68 | 3738 | 3680 | 826.6 |
| C | 6 | 253 | 23612 | 24.11 | 3738 | 3680 | 826.6 |
| D | 1 | 52 | 6948297 | 7756.79 | 3693 | 3586 | 895.3 |
| D | 13 | 104 | 2119245 | 2363.05 | 3693 | 3586 | 895.3 |
| D | 10 | 157 | 1692277 | 1886.16 | 3693 | 3586 | 895.3 |
Histogram calculated using DETX and DETY for each event in the final _common_clean file
| Quadrant A |  |
 |
Quadrant B |
|---|---|---|---|
| Quadrant D |  |
 |
Quadrant C |
| Plot type | Count rate plots | Images |
|---|---|---|
| Comparison with Poisson distribution Blue bars denote a histogram of data divided into 1 sec bins. Red curve is a Poisson curve with rate = median count rate of data. |
 |
 |
| Quadrant-wise count rates Data is divided into 100 sec bins |
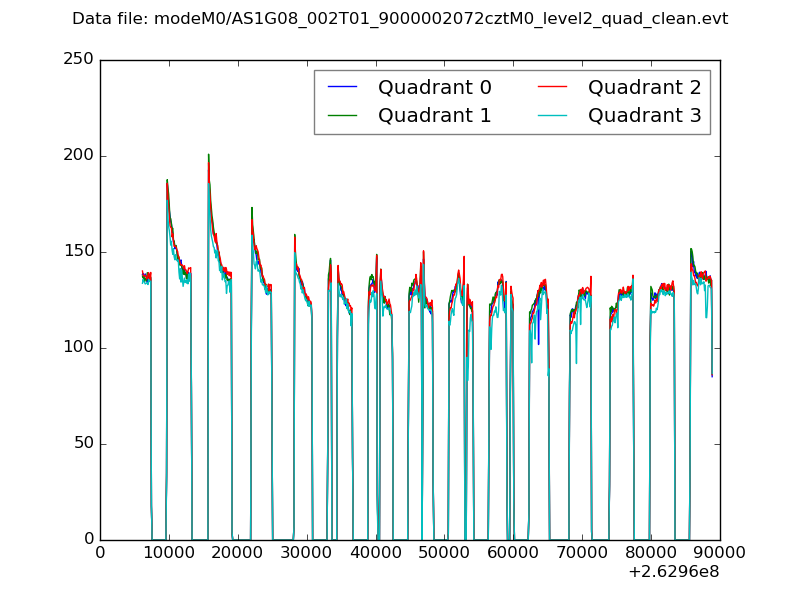 |
|
| Module-wise count rates for Quadrant A Data is divided into 100 sec bins |
 |
 |
| Module-wise count rates for Quadrant B Data is divided into 100 sec bins |
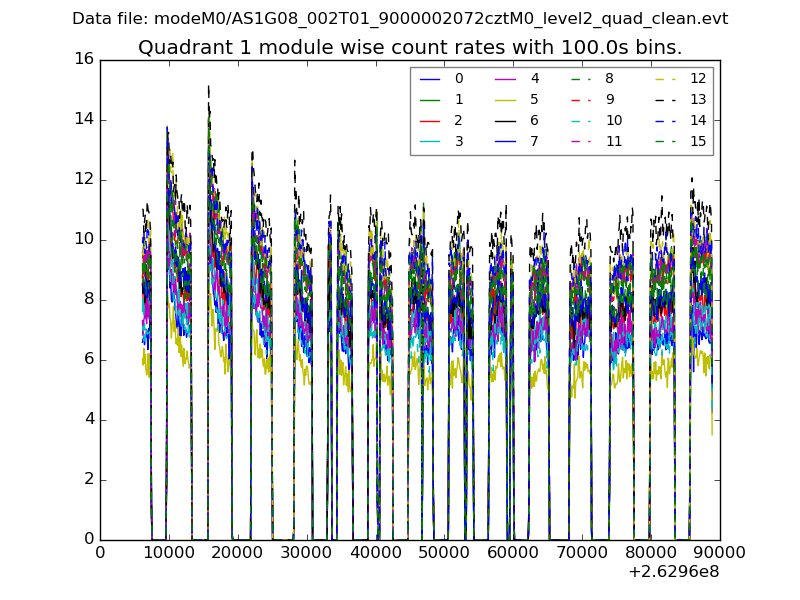 |
 |
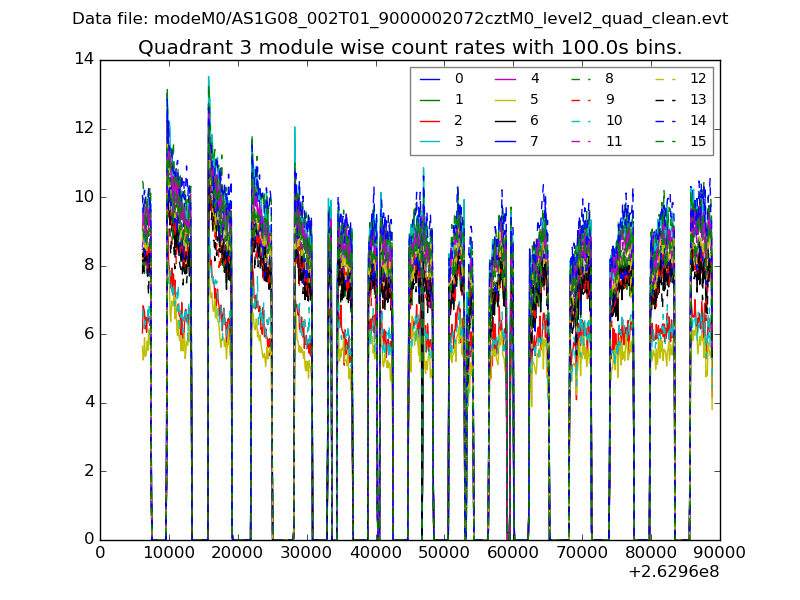
| Module-wise count rates for Quadrant C Data is divided into 100 sec bins |
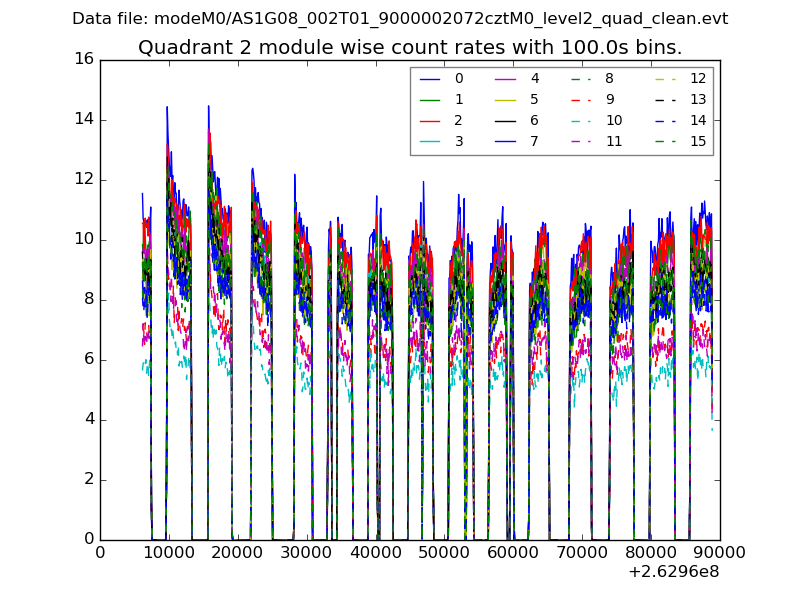 |
 |
| Module-wise count rates for Quadrant D Data is divided into 100 sec bins |
 |
 |
| Parameter | Plot |
|---|---|
| CZT HV Monitor | 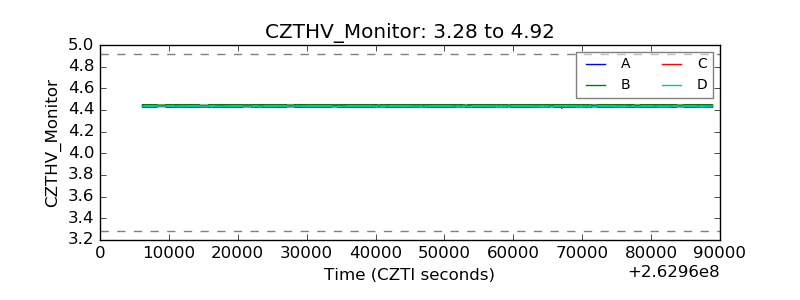 |
| D_VDD | 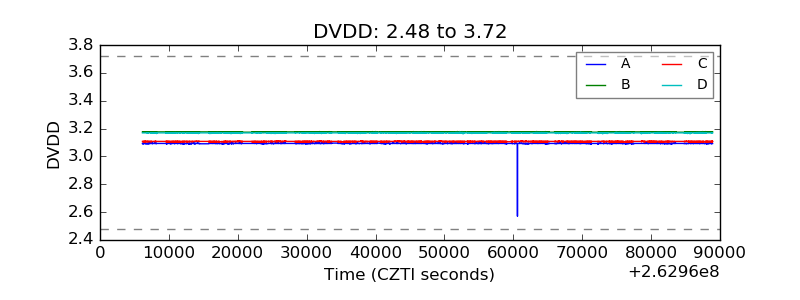 |
| Temperature 1 |  |
| Veto HV Monitor |  |
| Veto LLD |  |
| Alpha Counter |  |
| _CPM_Rate |  |
| CZT Counter | 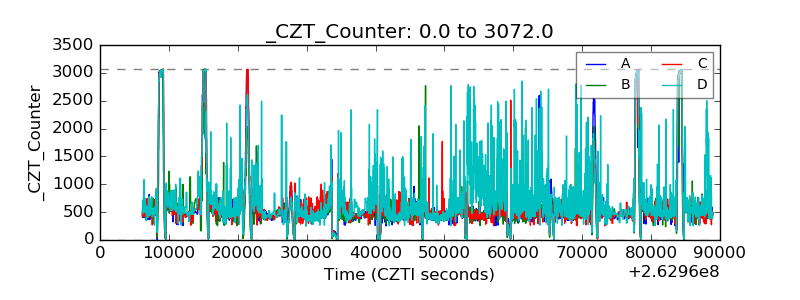 |
| +2.5 Volts monitor |  |
| +5 Volts monitor | 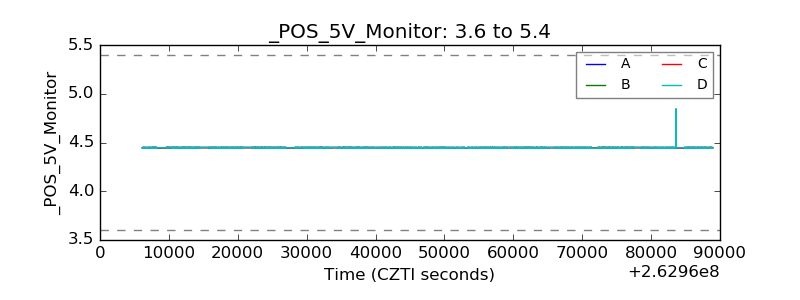 |
| _ROLL_ROT |  |
| _Roll_DEC | 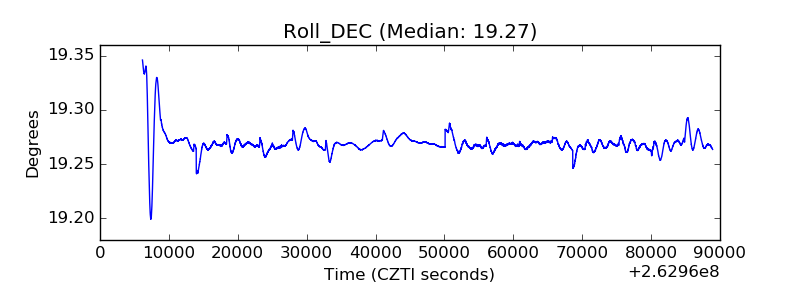 |
| _Roll_RA |  |
| Veto Counter |  |