| Param | Original file | Final file |
|---|---|---|
| Filename | modeM0/AS1A04_075T05_9000002066cztM0_level2_bc.evt | modeM0/AS1A04_075T05_9000002066cztM0_level2_quad_clean.evt |
| Size (bytes) | 548,968,320 | 190,402,560 |
| Size | 523.5 MB | 181.6 MB |
| Events in quadrant A | 2,847,763 | 1,246,165 |
| Events in quadrant B | 3,166,062 | 1,260,673 |
| Events in quadrant C | 2,994,319 | 1,232,246 |
| Events in quadrant D | 6,739,224 | 1,142,862 |
| Mode SS | |||
|---|---|---|---|
| Quadrant | BADHDUFLAG | Total packets | Discarded packets |
| A | 0 | 260 | 0 |
| B | 0 | 260 | 0 |
| C | 0 | 260 | 0 |
| D | 0 | 260 | 0 |
| Mode M9 | |||
|---|---|---|---|
| Quadrant | BADHDUFLAG | Total packets | Discarded packets |
| A | 0 | 30 | 0 |
| B | 0 | 30 | 0 |
| C | 0 | 30 | 0 |
| D | 0 | 30 | 0 |
| Mode M0 | |||
|---|---|---|---|
| Quadrant | BADHDUFLAG | Total packets | Discarded packets |
| A | 0 | 27167 | 0 |
| B | 0 | 28329 | 0 |
| C | 0 | 27115 | 0 |
| D | 0 | 39302 | 0 |
| Quadrant | Total seconds | Saturated seconds | Saturation percentage |
|---|---|---|---|
| A | 12807 | 126 | 0.983837% |
| B | 12807 | 158 | 1.233700% |
| C | 12807 | 73 | 0.570001% |
| D | 12807 | 784 | 6.121652% |
Noise dominated data is calculated using 1-second bins in cleaned event files. If a bin has >2000 counts, and if more than 50% of those come from <1% of pixels, then it is considered to be noise-dominated and hence unusable.
| Quadrant | # 1 sec bins | Bins with >0 counts | Bins with >2000 counts | High rate bins dominated by noise | Noise dominated (total time) | Noise dominated (detector-on time) | Marked lightcurve |
|---|---|---|---|---|---|---|---|
| A | 15062 | 12807 | 1 | 1 | 0.01% | 0.01% |  |
| B | 15062 | 12807 | 10 | 10 | 0.07% | 0.08% | 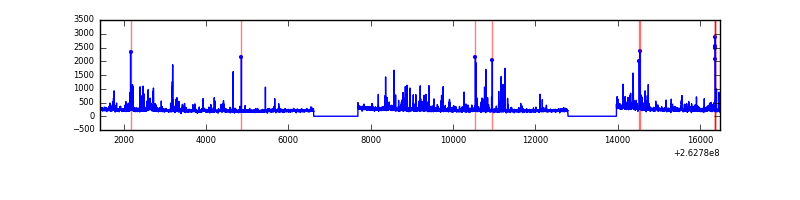 |
| C | 15062 | 12807 | 0 | 0 | 0.00% | 0.00% |  |
| D | 15062 | 12807 | 380 | 380 | 2.52% | 2.97% |  |
Top three noisy pixels from each quadrant. If the there are fewer than three noisy pixels in the level2.evt file, extra rows are filled as -1
| Pixel properties | Quadrant properties | ||||||
|---|---|---|---|---|---|---|---|
| Quadrant | DetID | PixID | Counts | Sigma | Mean | Median | Sigma |
| A | 8 | 15 | 161521 | 1070.74 | 681 | 666 | 150.2 |
| A | 12 | 189 | 22114 | 142.77 | 681 | 666 | 150.2 |
| A | 1 | 162 | 20901 | 134.7 | 681 | 666 | 150.2 |
| B | 0 | 189 | 96472 | 737.02 | 687 | 671 | 130.0 |
| B | 10 | 245 | 94274 | 720.11 | 687 | 671 | 130.0 |
| B | 0 | 219 | 83935 | 640.57 | 687 | 671 | 130.0 |
| C | 3 | 233 | 364915 | 2443.72 | 666 | 656 | 149.1 |
| C | 0 | 207 | 23467 | 153.03 | 666 | 656 | 149.1 |
| C | 14 | 234 | 6387 | 38.45 | 666 | 656 | 149.1 |
| D | 1 | 52 | 1703349 | 10675.47 | 650 | 630 | 159.5 |
| D | 8 | 195 | 645470 | 4042.93 | 650 | 630 | 159.5 |
| D | 12 | 110 | 553005 | 3463.2 | 650 | 630 | 159.5 |
Histogram calculated using DETX and DETY for each event in the final _common_clean file
| Quadrant A | 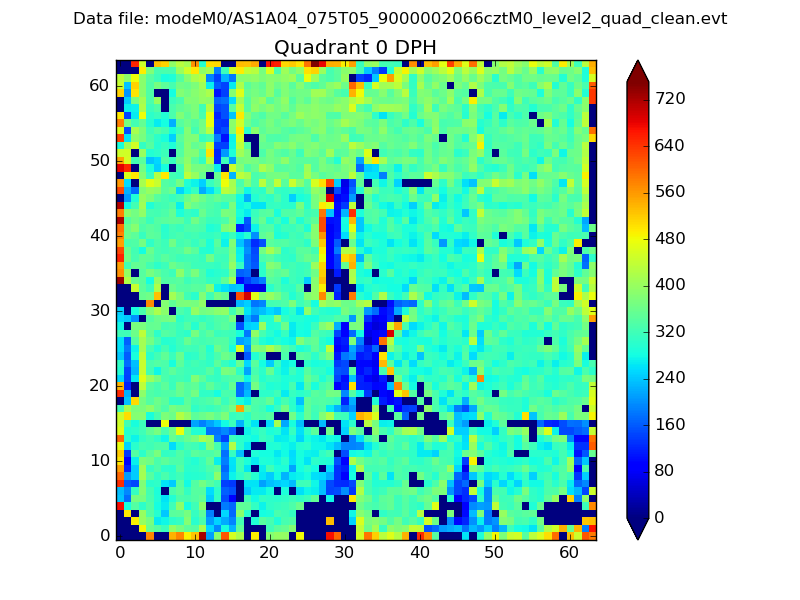 |
 |
Quadrant B |
|---|---|---|---|
| Quadrant D |  |
 |
Quadrant C |
| Plot type | Count rate plots | Images |
|---|---|---|
| Comparison with Poisson distribution Blue bars denote a histogram of data divided into 1 sec bins. Red curve is a Poisson curve with rate = median count rate of data. |
 |
 |
| Quadrant-wise count rates Data is divided into 100 sec bins |
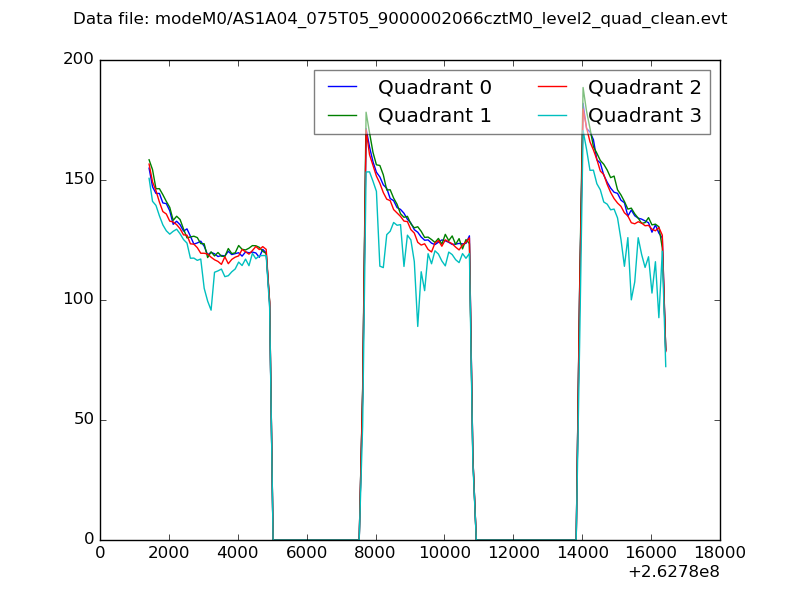 |
|
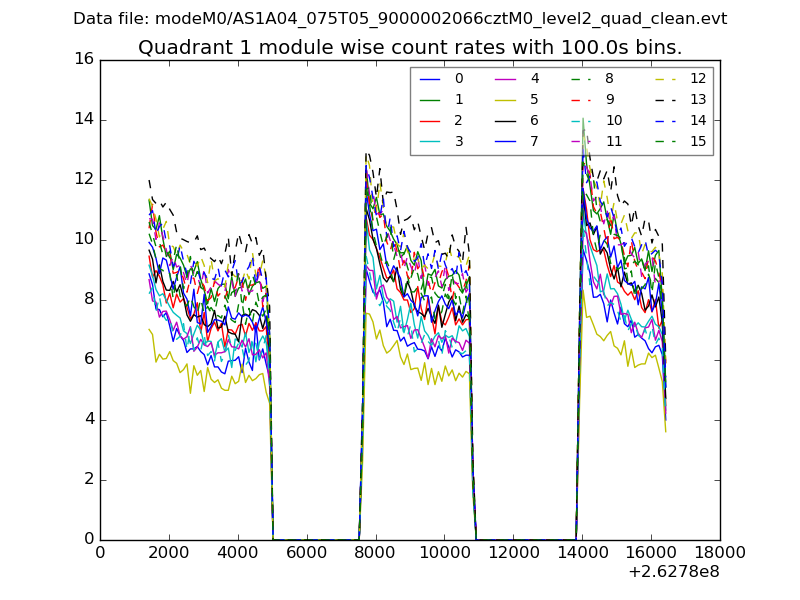
| Module-wise count rates for Quadrant A Data is divided into 100 sec bins |
 |
 |
| Module-wise count rates for Quadrant B Data is divided into 100 sec bins |
 |
 |
| Module-wise count rates for Quadrant C Data is divided into 100 sec bins |
 |
 |
| Module-wise count rates for Quadrant D Data is divided into 100 sec bins |
 |
 |
| Parameter | Plot |
|---|---|
| CZT HV Monitor |  |
| D_VDD |  |
| Temperature 1 | 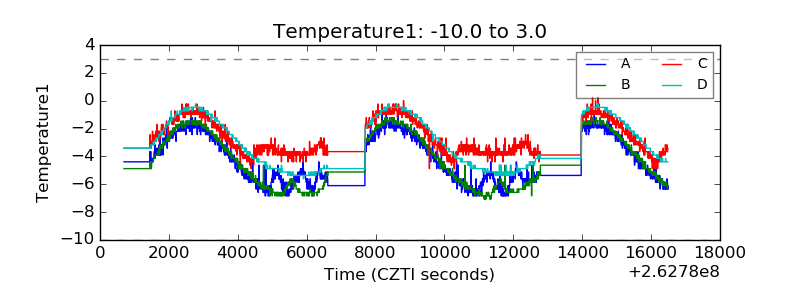 |
| Veto HV Monitor |  |
| Veto LLD |  |
| Alpha Counter |  |
| _CPM_Rate |  |
| CZT Counter | 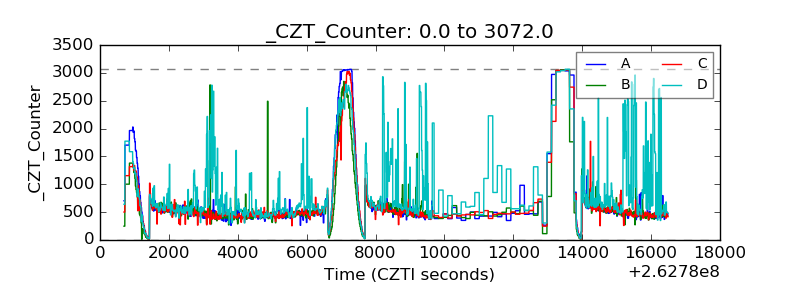 |
| +2.5 Volts monitor |  |
| +5 Volts monitor |  |
| _ROLL_ROT |  |
| _Roll_DEC |  |
| _Roll_RA |  |
| Veto Counter |  |