| Param | Original file | Final file |
|---|---|---|
| Filename | modeM0/AS1A04_038T02_9000002068cztM0_level2_bc.evt | modeM0/AS1A04_038T02_9000002068cztM0_level2_quad_clean.evt |
| Size (bytes) | 2,333,960,640 | 1,027,872,000 |
| Size | 2.2 GB | 980.3 MB |
| Events in quadrant A | 11,547,450 | 7,012,797 |
| Events in quadrant B | 14,154,448 | 7,064,383 |
| Events in quadrant C | 12,462,292 | 6,832,866 |
| Events in quadrant D | 28,755,273 | 6,433,209 |
| Mode M9 | |||
|---|---|---|---|
| Quadrant | BADHDUFLAG | Total packets | Discarded packets |
| A | 0 | 76 | 0 |
| B | 0 | 76 | 0 |
| C | 0 | 76 | 0 |
| D | 0 | 76 | 0 |
| Mode SS | |||
|---|---|---|---|
| Quadrant | BADHDUFLAG | Total packets | Discarded packets |
| A | 0 | 1124 | 0 |
| B | 0 | 1124 | 0 |
| C | 0 | 1124 | 0 |
| D | 0 | 1124 | 0 |
| Mode M0 | |||
|---|---|---|---|
| Quadrant | BADHDUFLAG | Total packets | Discarded packets |
| A | 0 | 114806 | 0 |
| B | 0 | 123851 | 0 |
| C | 0 | 115565 | 0 |
| D | 0 | 168163 | 0 |
| Quadrant | Total seconds | Saturated seconds | Saturation percentage |
|---|---|---|---|
| A | 55270 | 808 | 1.461914% |
| B | 55270 | 1351 | 2.444364% |
| C | 55270 | 737 | 1.333454% |
| D | 55270 | 4223 | 7.640673% |
Noise dominated data is calculated using 1-second bins in cleaned event files. If a bin has >2000 counts, and if more than 50% of those come from <1% of pixels, then it is considered to be noise-dominated and hence unusable.
| Quadrant | # 1 sec bins | Bins with >0 counts | Bins with >2000 counts | High rate bins dominated by noise | Noise dominated (total time) | Noise dominated (detector-on time) | Marked lightcurve |
|---|---|---|---|---|---|---|---|
| A | 62951 | 55274 | 3 | 3 | 0.00% | 0.01% |  |
| B | 62951 | 55273 | 44 | 44 | 0.07% | 0.08% |  |
| C | 62951 | 55274 | 14 | 14 | 0.02% | 0.03% | 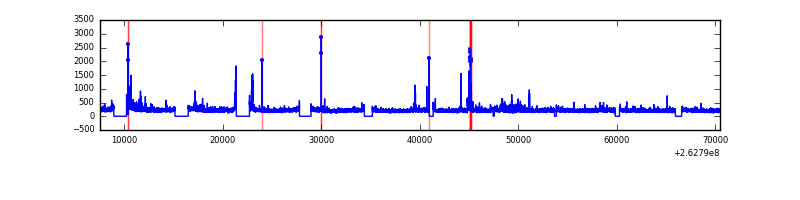 |
| D | 62951 | 55272 | 1314 | 1314 | 2.09% | 2.38% |  |
Top three noisy pixels from each quadrant. If the there are fewer than three noisy pixels in the level2.evt file, extra rows are filled as -1
| Pixel properties | Quadrant properties | ||||||
|---|---|---|---|---|---|---|---|
| Quadrant | DetID | PixID | Counts | Sigma | Mean | Median | Sigma |
| A | 12 | 189 | 257403 | 409.1 | 2810 | 2758 | 622.5 |
| A | 8 | 15 | 214858 | 340.75 | 2810 | 2758 | 622.5 |
| A | 1 | 162 | 82028 | 127.35 | 2810 | 2758 | 622.5 |
| B | 10 | 16 | 786808 | 1458.27 | 2818 | 2742 | 537.7 |
| B | 0 | 189 | 609524 | 1128.54 | 2818 | 2742 | 537.7 |
| B | 0 | 219 | 532070 | 984.48 | 2818 | 2742 | 537.7 |
| C | 3 | 233 | 1358996 | 2274.16 | 2703 | 2665 | 596.4 |
| C | 14 | 220 | 392146 | 653.04 | 2703 | 2665 | 596.4 |
| C | 0 | 207 | 55954 | 89.35 | 2703 | 2665 | 596.4 |
| D | 1 | 52 | 8978783 | 13775.64 | 2653 | 2576 | 651.6 |
| D | 13 | 104 | 3208066 | 4919.41 | 2653 | 2576 | 651.6 |
| D | 10 | 157 | 2034753 | 3118.75 | 2653 | 2576 | 651.6 |
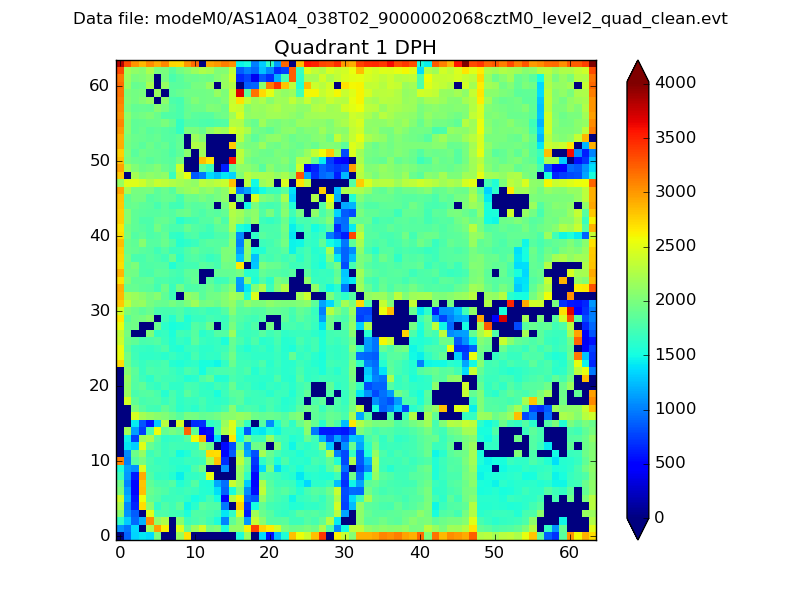
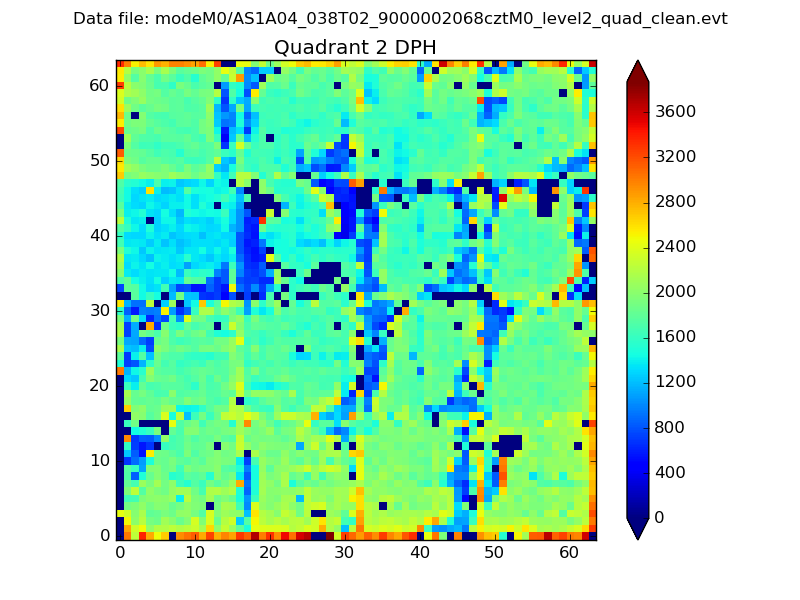
Histogram calculated using DETX and DETY for each event in the final _common_clean file
| Quadrant A |  |
 |
Quadrant B |
|---|---|---|---|
| Quadrant D | 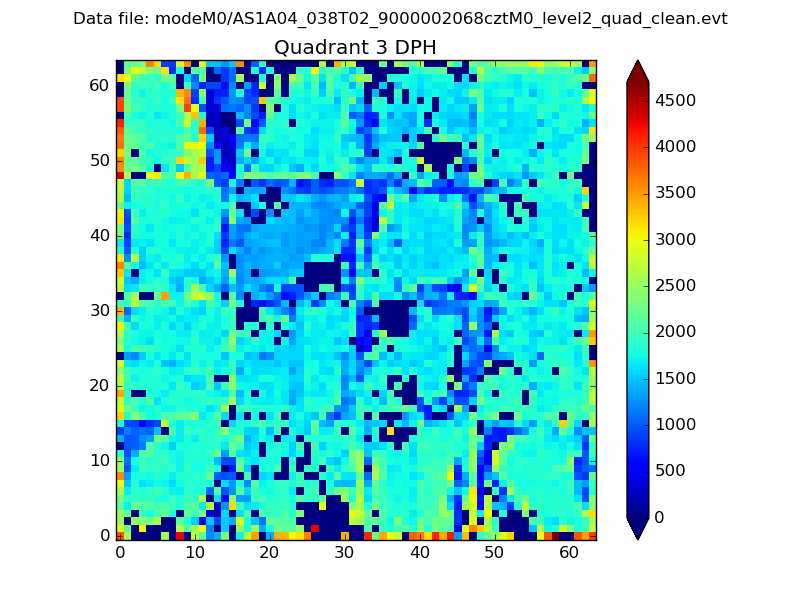 |
 |
Quadrant C |
| Plot type | Count rate plots | Images |
|---|---|---|
| Comparison with Poisson distribution Blue bars denote a histogram of data divided into 1 sec bins. Red curve is a Poisson curve with rate = median count rate of data. |
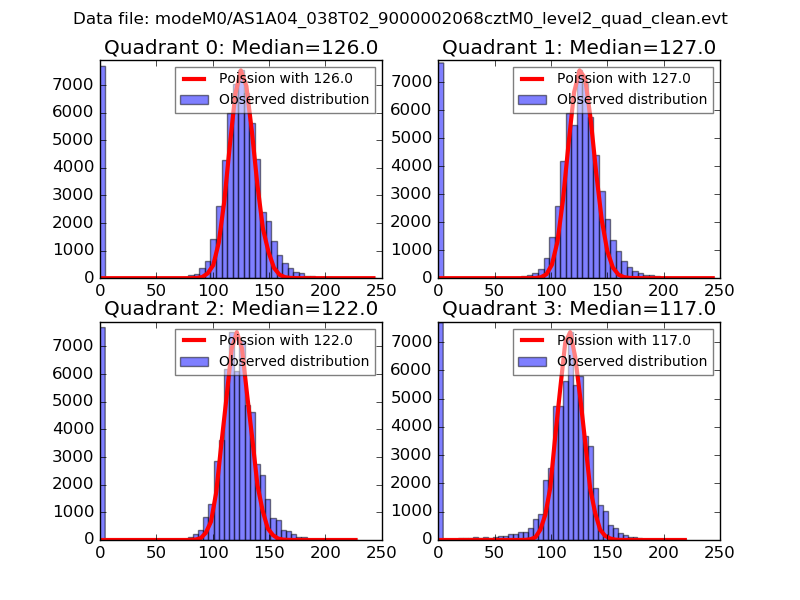 |
 |
| Quadrant-wise count rates Data is divided into 100 sec bins |
 |
|
| Module-wise count rates for Quadrant A Data is divided into 100 sec bins |
 |
 |
| Module-wise count rates for Quadrant B Data is divided into 100 sec bins |
 |
 |
| Module-wise count rates for Quadrant C Data is divided into 100 sec bins |
 |
 |
| Module-wise count rates for Quadrant D Data is divided into 100 sec bins |
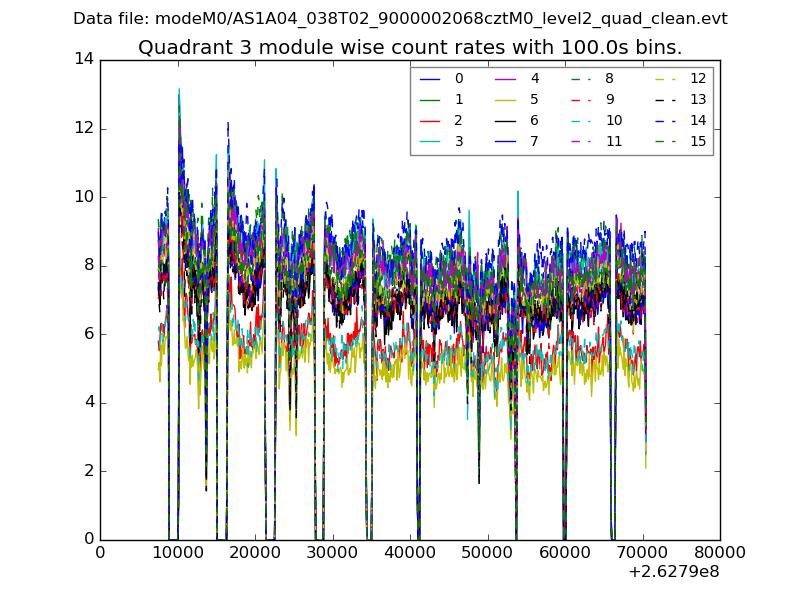 |
 |
| Parameter | Plot |
|---|---|
| CZT HV Monitor | 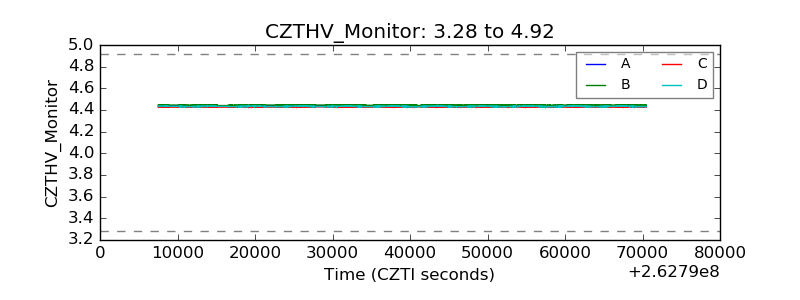 |
| D_VDD |  |
| Temperature 1 |  |
| Veto HV Monitor |  |
| Veto LLD | 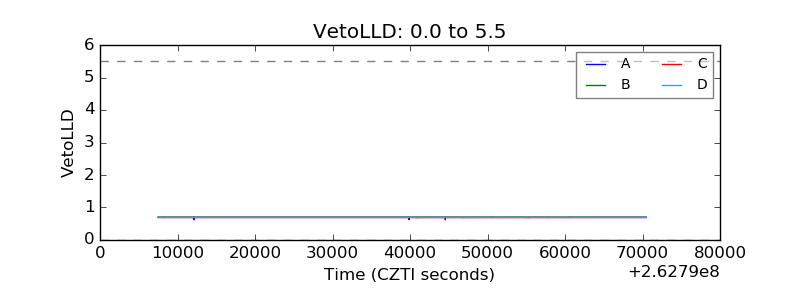 |
| Alpha Counter |  |
| _CPM_Rate |  |
| CZT Counter |  |
| +2.5 Volts monitor |  |
| +5 Volts monitor |  |
| _ROLL_ROT | 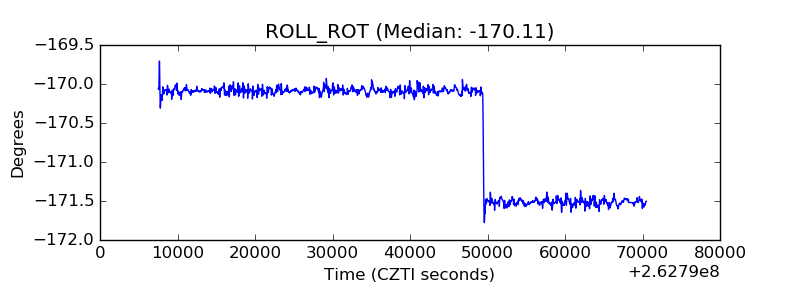 |
| _Roll_DEC |  |
| _Roll_RA |  |
| Veto Counter | 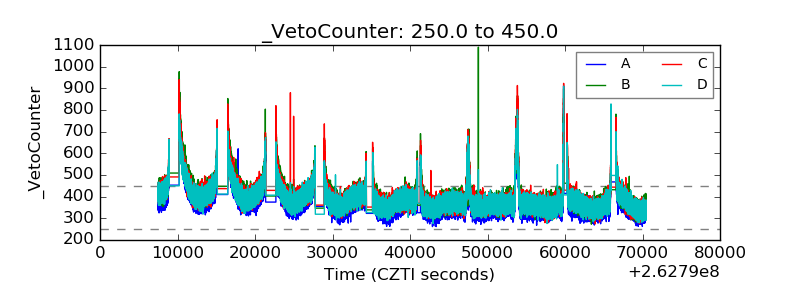 |