| Param | Original file | Final file |
|---|---|---|
| Filename | modeM0/AS1A04_122T01_9000002064cztM0_level2_bc.evt | modeM0/AS1A04_122T01_9000002064cztM0_level2_quad_clean.evt |
| Size (bytes) | 4,005,325,440 | 1,359,270,720 |
| Size | 3.7 GB | 1.3 GB |
| Events in quadrant A | 22,816,365 | 8,674,086 |
| Events in quadrant B | 23,998,068 | 9,283,952 |
| Events in quadrant C | 23,734,519 | 8,435,138 |
| Events in quadrant D | 43,846,462 | 7,824,232 |
| Mode M9 | |||
|---|---|---|---|
| Quadrant | BADHDUFLAG | Total packets | Discarded packets |
| A | 0 | 131 | 0 |
| B | 0 | 131 | 0 |
| C | 0 | 131 | 0 |
| D | 0 | 131 | 0 |
| Mode M0 | |||
|---|---|---|---|
| Quadrant | BADHDUFLAG | Total packets | Discarded packets |
| A | 0 | 215357 | 0 |
| B | 0 | 218363 | 0 |
| C | 0 | 213416 | 0 |
| D | 0 | 289027 | 0 |
| Mode SS | |||
|---|---|---|---|
| Quadrant | BADHDUFLAG | Total packets | Discarded packets |
| A | 0 | 2058 | 0 |
| B | 0 | 2058 | 0 |
| C | 0 | 2058 | 0 |
| D | 0 | 2058 | 0 |
| Quadrant | Total seconds | Saturated seconds | Saturation percentage |
|---|---|---|---|
| A | 101460 | 1709 | 1.684408% |
| B | 101461 | 1884 | 1.856871% |
| C | 101461 | 1089 | 1.073319% |
| D | 101461 | 5591 | 5.510492% |
Noise dominated data is calculated using 1-second bins in cleaned event files. If a bin has >2000 counts, and if more than 50% of those come from <1% of pixels, then it is considered to be noise-dominated and hence unusable.
| Quadrant | # 1 sec bins | Bins with >0 counts | Bins with >2000 counts | High rate bins dominated by noise | Noise dominated (total time) | Noise dominated (detector-on time) | Marked lightcurve |
|---|---|---|---|---|---|---|---|
| A | 114577 | 101465 | 10 | 10 | 0.01% | 0.01% |  |
| B | 114577 | 101462 | 33 | 33 | 0.03% | 0.03% |  |
| C | 114577 | 101465 | 2 | 2 | 0.00% | 0.00% | 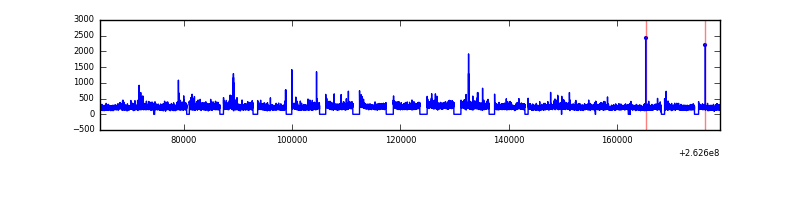 |
| D | 114577 | 101464 | 981 | 981 | 0.86% | 0.97% |  |
Top three noisy pixels from each quadrant. If the there are fewer than three noisy pixels in the level2.evt file, extra rows are filled as -1
| Pixel properties | Quadrant properties | ||||||
|---|---|---|---|---|---|---|---|
| Quadrant | DetID | PixID | Counts | Sigma | Mean | Median | Sigma |
| A | 8 | 15 | 1605129 | 1375.56 | 5317 | 5192 | 1163.1 |
| A | 1 | 162 | 227126 | 190.81 | 5317 | 5192 | 1163.1 |
| A | 4 | 2 | 216394 | 181.58 | 5317 | 5192 | 1163.1 |
| B | 0 | 189 | 463529 | 429.17 | 5530 | 5370 | 1067.6 |
| B | 4 | 80 | 392724 | 362.84 | 5530 | 5370 | 1067.6 |
| B | 3 | 209 | 366823 | 338.58 | 5530 | 5370 | 1067.6 |
| C | 3 | 233 | 3327650 | 2905.99 | 5184 | 5114 | 1143.3 |
| C | 8 | 128 | 42835 | 32.99 | 5184 | 5114 | 1143.3 |
| C | 14 | 234 | 40422 | 30.88 | 5184 | 5114 | 1143.3 |
| D | 10 | 157 | 7453354 | 6298.08 | 5015 | 4874 | 1182.7 |
| D | 1 | 52 | 5916955 | 4998.98 | 5015 | 4874 | 1182.7 |
| D | 13 | 122 | 4245997 | 3586.09 | 5015 | 4874 | 1182.7 |
Histogram calculated using DETX and DETY for each event in the final _common_clean file
| Quadrant A | 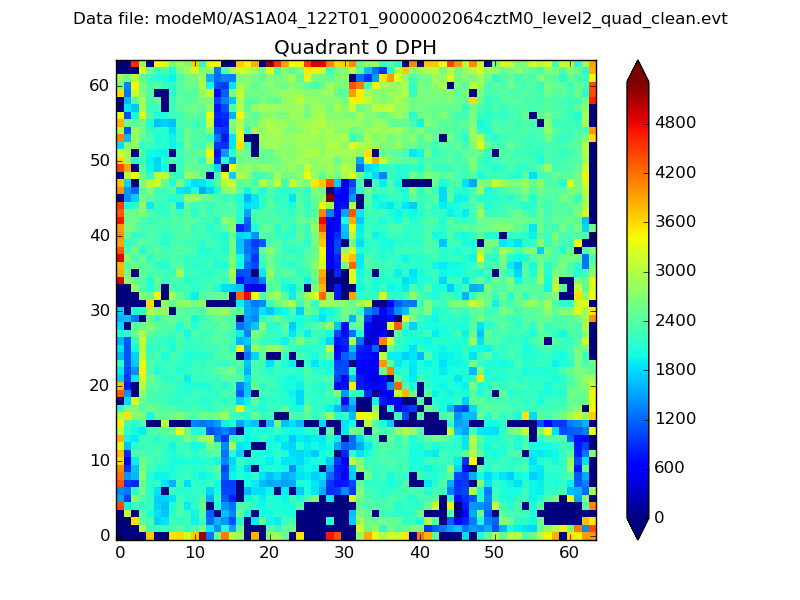 |
 |
Quadrant B |
|---|---|---|---|
| Quadrant D |  |
 |
Quadrant C |
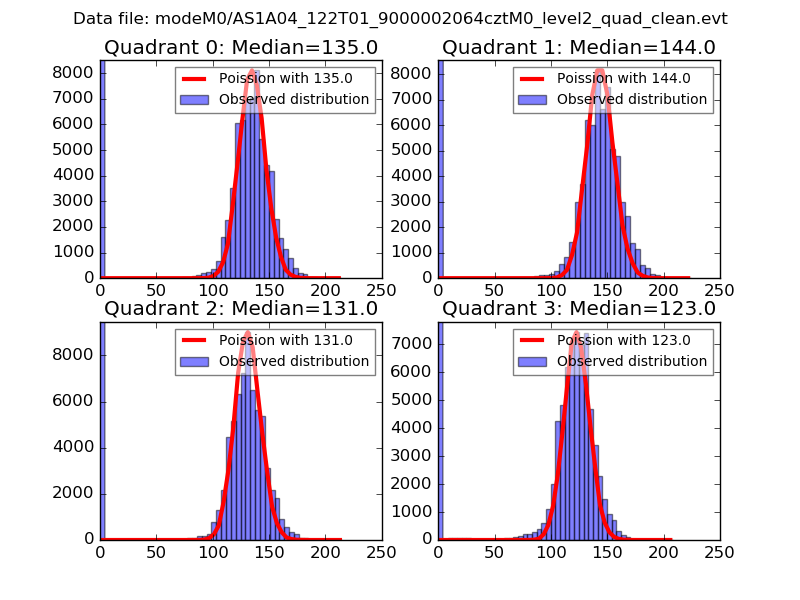
| Plot type | Count rate plots | Images |
|---|---|---|
| Comparison with Poisson distribution Blue bars denote a histogram of data divided into 1 sec bins. Red curve is a Poisson curve with rate = median count rate of data. |
 |
 |
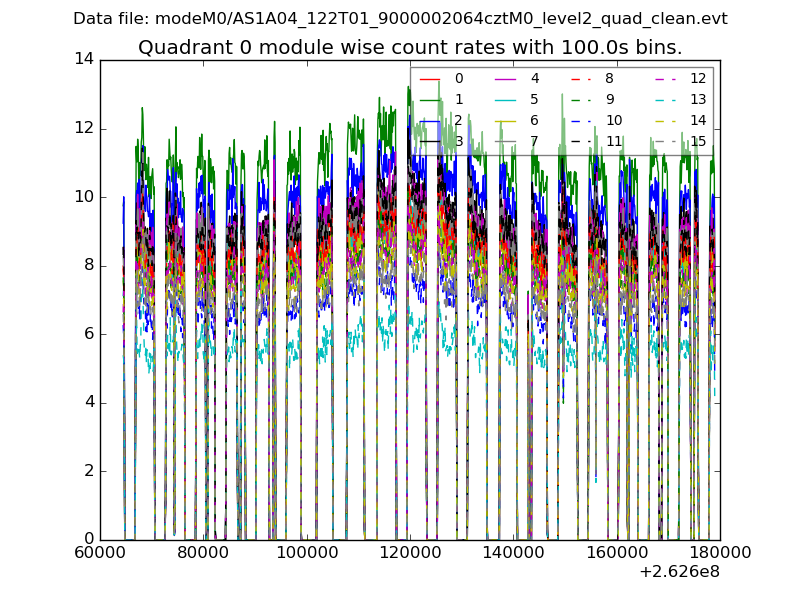
| Quadrant-wise count rates Data is divided into 100 sec bins |
 |
|
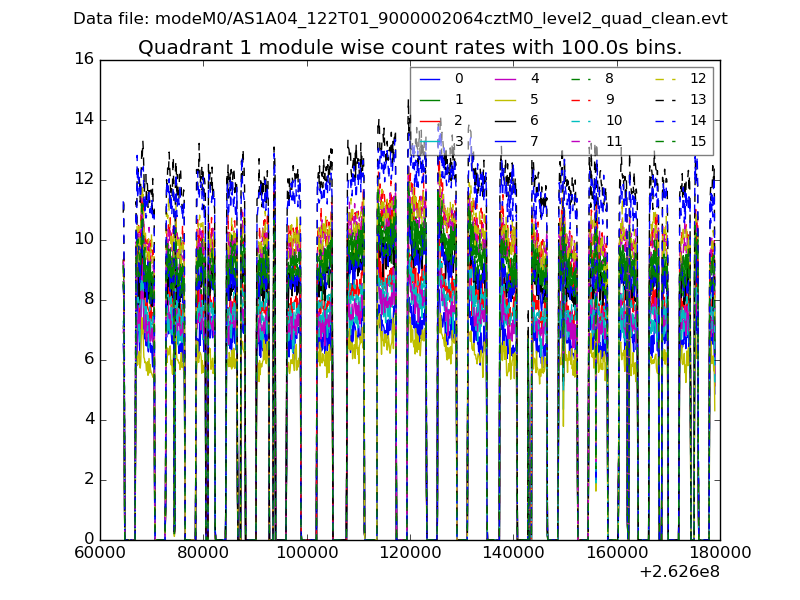
| Module-wise count rates for Quadrant A Data is divided into 100 sec bins |
 |
 |
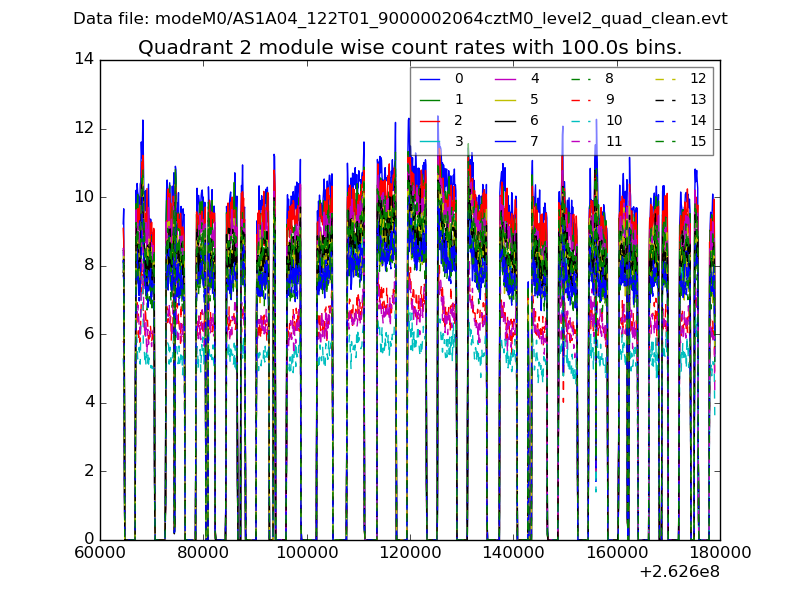
| Module-wise count rates for Quadrant B Data is divided into 100 sec bins |
 |
 |
| Module-wise count rates for Quadrant C Data is divided into 100 sec bins |
 |
 |
| Module-wise count rates for Quadrant D Data is divided into 100 sec bins |
 |
 |
| Parameter | Plot |
|---|---|
| CZT HV Monitor |  |
| D_VDD | 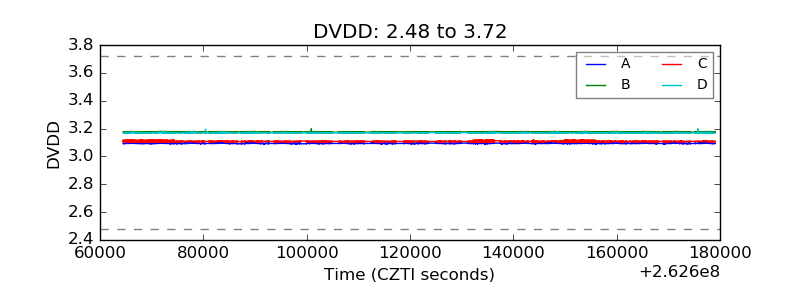 |
| Temperature 1 |  |
| Veto HV Monitor |  |
| Veto LLD |  |
| Alpha Counter |  |
| _CPM_Rate |  |
| CZT Counter | 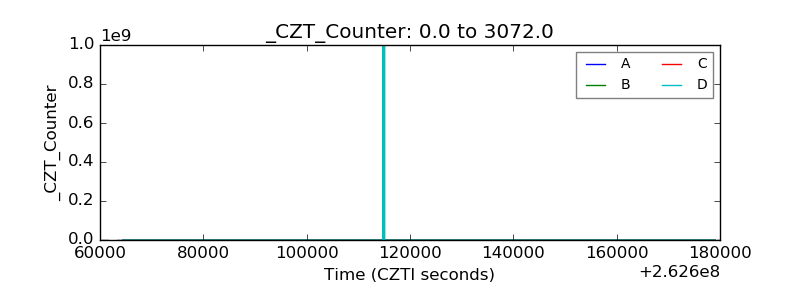 |
| +2.5 Volts monitor |  |
| +5 Volts monitor |  |
| _ROLL_ROT |  |
| _Roll_DEC |  |
| _Roll_RA | 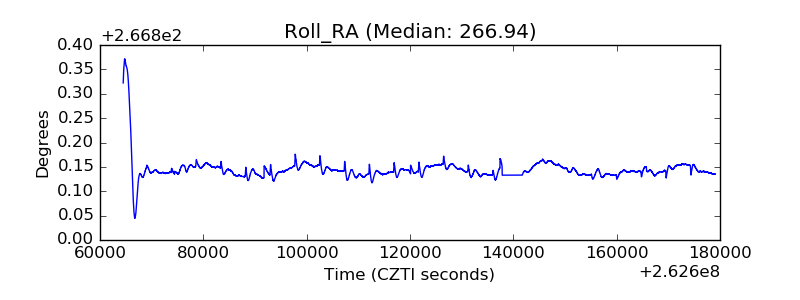 |
| Veto Counter |  |