| Param | Original file | Final file |
|---|---|---|
| Filename | modeM0/AS1T02_041T01_9000002058cztM0_level2_bc.evt | modeM0/AS1T02_041T01_9000002058cztM0_level2_quad_clean.evt |
| Size (bytes) | 3,890,289,600 | 1,239,168,960 |
| Size | 3.6 GB | 1.2 GB |
| Events in quadrant A | 15,567,764 | 8,022,451 |
| Events in quadrant B | 21,878,842 | 8,086,767 |
| Events in quadrant C | 20,181,483 | 8,407,437 |
| Events in quadrant D | 54,884,386 | 7,664,997 |
| Mode M9 | |||
|---|---|---|---|
| Quadrant | BADHDUFLAG | Total packets | Discarded packets |
| A | 0 | 121 | 0 |
| B | 0 | 121 | 0 |
| C | 0 | 121 | 0 |
| D | 0 | 121 | 0 |
| Mode M0 | |||
|---|---|---|---|
| Quadrant | BADHDUFLAG | Total packets | Discarded packets |
| A | 0 | 160586 | 0 |
| B | 0 | 182550 | 0 |
| C | 0 | 172605 | 0 |
| D | 0 | 286606 | 0 |
| Mode SS | |||
|---|---|---|---|
| Quadrant | BADHDUFLAG | Total packets | Discarded packets |
| A | 0 | 1590 | 0 |
| B | 0 | 1590 | 0 |
| C | 0 | 1590 | 0 |
| D | 0 | 1590 | 0 |
| Quadrant | Total seconds | Saturated seconds | Saturation percentage |
|---|---|---|---|
| A | 78060 | 804 | 1.029977% |
| B | 78060 | 2507 | 3.211632% |
| C | 78060 | 1259 | 1.612862% |
| D | 78060 | 8053 | 10.316423% |
Noise dominated data is calculated using 1-second bins in cleaned event files. If a bin has >2000 counts, and if more than 50% of those come from <1% of pixels, then it is considered to be noise-dominated and hence unusable.
| Quadrant | # 1 sec bins | Bins with >0 counts | Bins with >2000 counts | High rate bins dominated by noise | Noise dominated (total time) | Noise dominated (detector-on time) | Marked lightcurve |
|---|---|---|---|---|---|---|---|
| A | 90065 | 78052 | 1 | 1 | 0.00% | 0.00% |  |
| B | 90065 | 78051 | 231 | 231 | 0.26% | 0.30% |  |
| C | 90065 | 78050 | 42 | 42 | 0.05% | 0.05% |  |
| D | 90065 | 78050 | 1804 | 1804 | 2.00% | 2.31% |  |
Top three noisy pixels from each quadrant. If the there are fewer than three noisy pixels in the level2.evt file, extra rows are filled as -1
| Pixel properties | Quadrant properties | ||||||
|---|---|---|---|---|---|---|---|
| Quadrant | DetID | PixID | Counts | Sigma | Mean | Median | Sigma |
| A | 1 | 162 | 138287 | 156.16 | 3947 | 3873 | 860.7 |
| A | 15 | 222 | 86461 | 95.95 | 3947 | 3873 | 860.7 |
| A | 14 | 111 | 56056 | 60.63 | 3947 | 3873 | 860.7 |
| B | 10 | 245 | 1772058 | 2340.04 | 3973 | 3862 | 755.6 |
| B | 0 | 85 | 1418877 | 1872.64 | 3973 | 3862 | 755.6 |
| B | 3 | 64 | 999836 | 1318.08 | 3973 | 3862 | 755.6 |
| C | 4 | 254 | 2810188 | 3107.19 | 4021 | 3981 | 903.1 |
| C | 3 | 233 | 1570414 | 1734.44 | 4021 | 3981 | 903.1 |
| C | 14 | 234 | 33227 | 32.38 | 4021 | 3981 | 903.1 |
| D | 1 | 52 | 30916654 | 34266.97 | 3841 | 3740 | 902.1 |
| D | 12 | 110 | 3180759 | 3521.73 | 3841 | 3740 | 902.1 |
| D | 13 | 122 | 2113301 | 2338.45 | 3841 | 3740 | 902.1 |
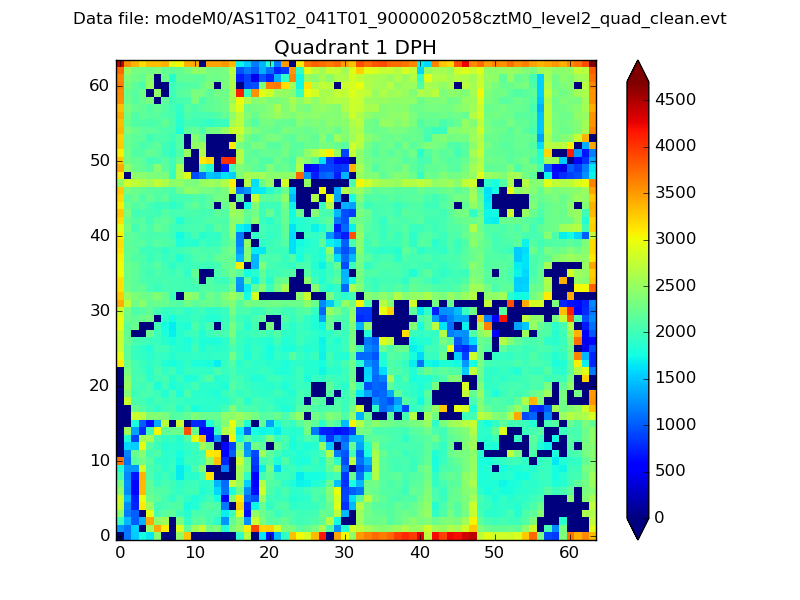
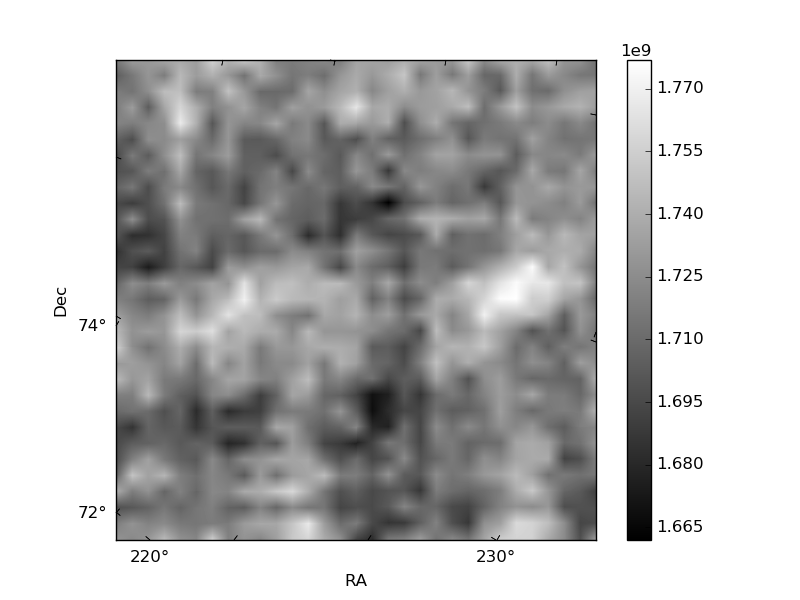
Histogram calculated using DETX and DETY for each event in the final _common_clean file
| Quadrant A |  |
 |
Quadrant B |
|---|---|---|---|
| Quadrant D | 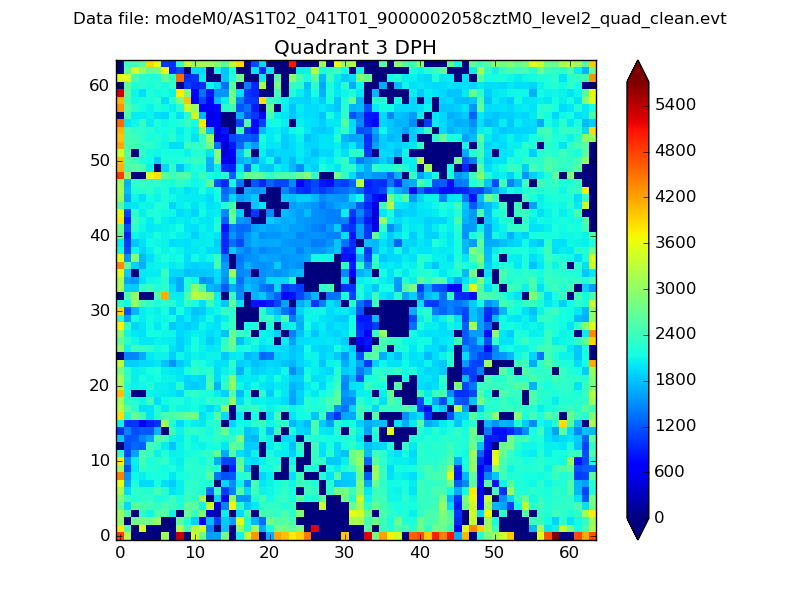 |
 |
Quadrant C |
| Plot type | Count rate plots | Images |
|---|---|---|
| Comparison with Poisson distribution Blue bars denote a histogram of data divided into 1 sec bins. Red curve is a Poisson curve with rate = median count rate of data. |
 |
 |
| Quadrant-wise count rates Data is divided into 100 sec bins |
 |
|
| Module-wise count rates for Quadrant A Data is divided into 100 sec bins |
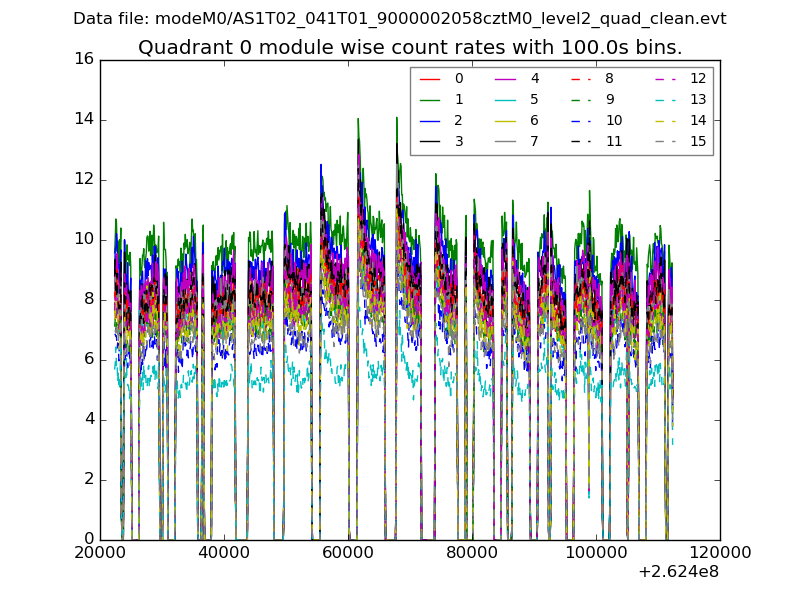 |
 |
| Module-wise count rates for Quadrant B Data is divided into 100 sec bins |
 |
 |
| Module-wise count rates for Quadrant C Data is divided into 100 sec bins |
 |
 |
| Module-wise count rates for Quadrant D Data is divided into 100 sec bins |
 |
 |
| Parameter | Plot |
|---|---|
| CZT HV Monitor | 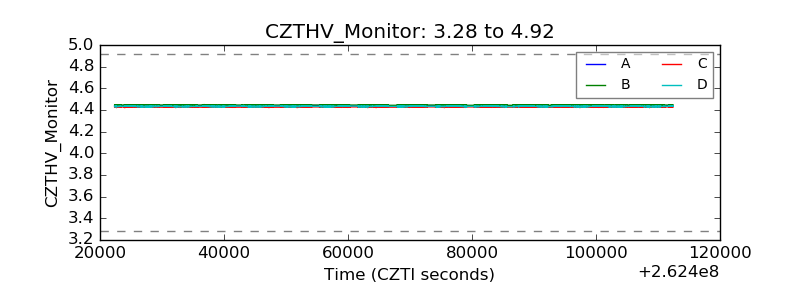 |
| D_VDD |  |
| Temperature 1 |  |
| Veto HV Monitor |  |
| Veto LLD |  |
| Alpha Counter |  |
| _CPM_Rate |  |
| CZT Counter |  |
| +2.5 Volts monitor |  |
| +5 Volts monitor | 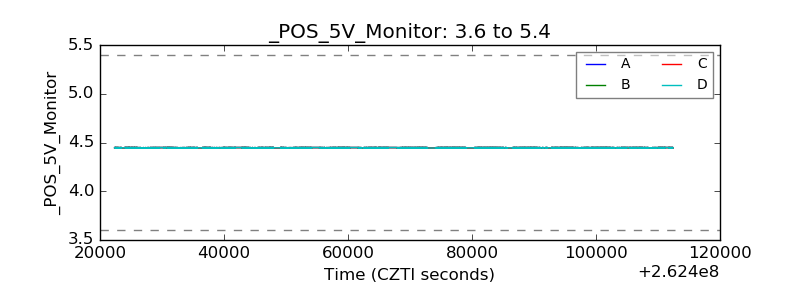 |
| _ROLL_ROT |  |
| _Roll_DEC |  |
| _Roll_RA | 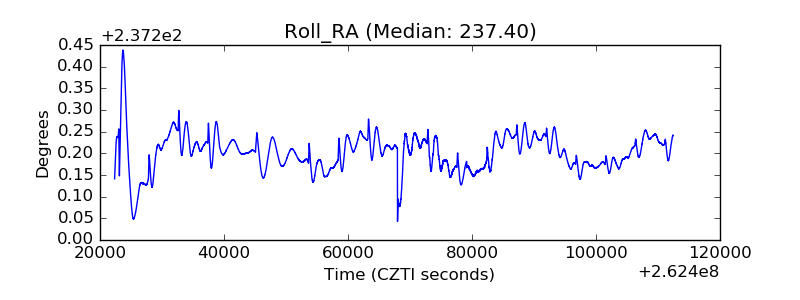 |
| Veto Counter | 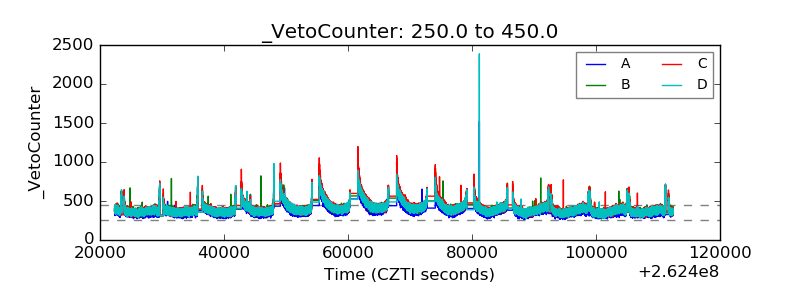 |