| Param | Original file | Final file |
|---|---|---|
| Filename | modeM0/AS1G08_076T01_9000002056cztM0_level2_bc.evt | modeM0/AS1G08_076T01_9000002056cztM0_level2_quad_clean.evt |
| Size (bytes) | 1,054,860,480 | 399,101,760 |
| Size | 1006.0 MB | 380.6 MB |
| Events in quadrant A | 5,911,491 | 2,443,582 |
| Events in quadrant B | 6,465,630 | 2,489,912 |
| Events in quadrant C | 6,748,073 | 2,621,868 |
| Events in quadrant D | 10,765,553 | 2,464,283 |
| Mode M9 | |||
|---|---|---|---|
| Quadrant | BADHDUFLAG | Total packets | Discarded packets |
| A | 0 | 33 | 0 |
| B | 0 | 33 | 0 |
| C | 0 | 33 | 0 |
| D | 0 | 33 | 0 |
| Mode M0 | |||
|---|---|---|---|
| Quadrant | BADHDUFLAG | Total packets | Discarded packets |
| A | 0 | 61851 | 0 |
| B | 0 | 63122 | 0 |
| C | 0 | 62402 | 0 |
| D | 0 | 76216 | 0 |
| Mode SS | |||
|---|---|---|---|
| Quadrant | BADHDUFLAG | Total packets | Discarded packets |
| A | 0 | 614 | 0 |
| B | 0 | 614 | 0 |
| C | 0 | 614 | 0 |
| D | 0 | 614 | 0 |
| Quadrant | Total seconds | Saturated seconds | Saturation percentage |
|---|---|---|---|
| A | 30096 | 317 | 1.053296% |
| B | 30096 | 419 | 1.392212% |
| C | 30096 | 221 | 0.734317% |
| D | 30096 | 802 | 2.664806% |
Noise dominated data is calculated using 1-second bins in cleaned event files. If a bin has >2000 counts, and if more than 50% of those come from <1% of pixels, then it is considered to be noise-dominated and hence unusable.
| Quadrant | # 1 sec bins | Bins with >0 counts | Bins with >2000 counts | High rate bins dominated by noise | Noise dominated (total time) | Noise dominated (detector-on time) | Marked lightcurve |
|---|---|---|---|---|---|---|---|
| A | 33362 | 30098 | 8 | 8 | 0.02% | 0.03% |  |
| B | 33362 | 30096 | 3 | 3 | 0.01% | 0.01% |  |
| C | 33362 | 30096 | 0 | 0 | 0.00% | 0.00% | 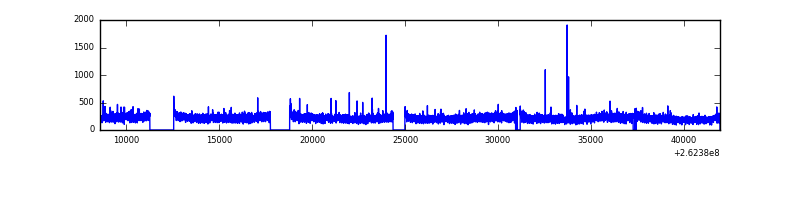 |
| D | 33362 | 30097 | 21 | 21 | 0.06% | 0.07% |  |
Top three noisy pixels from each quadrant. If the there are fewer than three noisy pixels in the level2.evt file, extra rows are filled as -1
| Pixel properties | Quadrant properties | ||||||
|---|---|---|---|---|---|---|---|
| Quadrant | DetID | PixID | Counts | Sigma | Mean | Median | Sigma |
| A | 8 | 15 | 55791 | 167.47 | 1484 | 1451 | 324.5 |
| A | 1 | 162 | 48877 | 146.16 | 1484 | 1451 | 324.5 |
| A | 4 | 2 | 34036 | 100.43 | 1484 | 1451 | 324.5 |
| B | 0 | 214 | 131983 | 454.79 | 1506 | 1465 | 287.0 |
| B | 10 | 245 | 117397 | 403.96 | 1506 | 1465 | 287.0 |
| B | 10 | 244 | 111997 | 385.15 | 1506 | 1465 | 287.0 |
| C | 3 | 233 | 747186 | 2162.41 | 1525 | 1508 | 344.8 |
| C | 14 | 234 | 21584 | 58.22 | 1525 | 1508 | 344.8 |
| C | 8 | 128 | 13483 | 34.73 | 1525 | 1508 | 344.8 |
| D | 1 | 52 | 2103891 | 5994.22 | 1489 | 1445 | 350.7 |
| D | 13 | 189 | 649656 | 1848.09 | 1489 | 1445 | 350.7 |
| D | 8 | 195 | 594195 | 1689.97 | 1489 | 1445 | 350.7 |
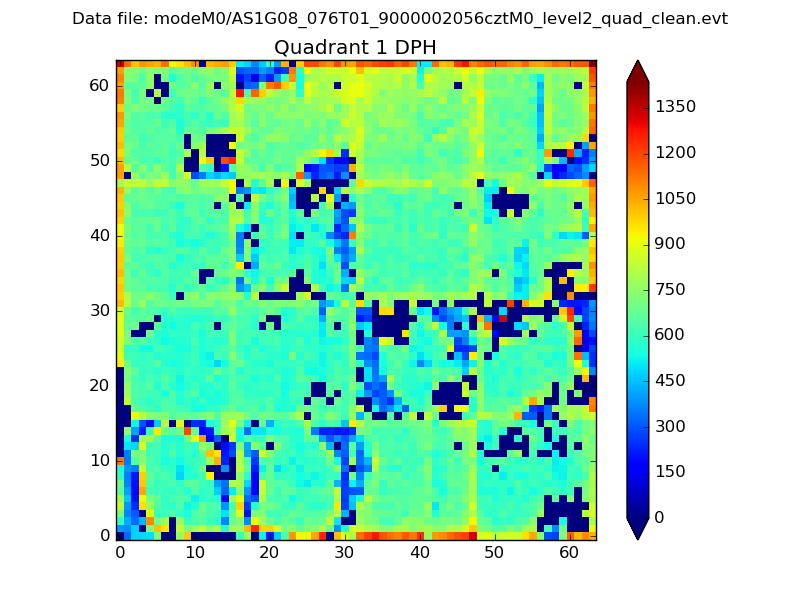
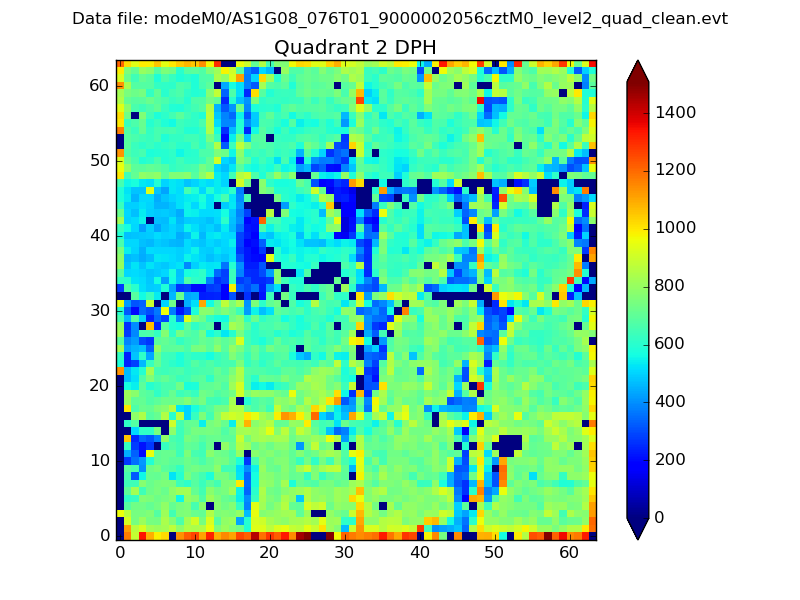
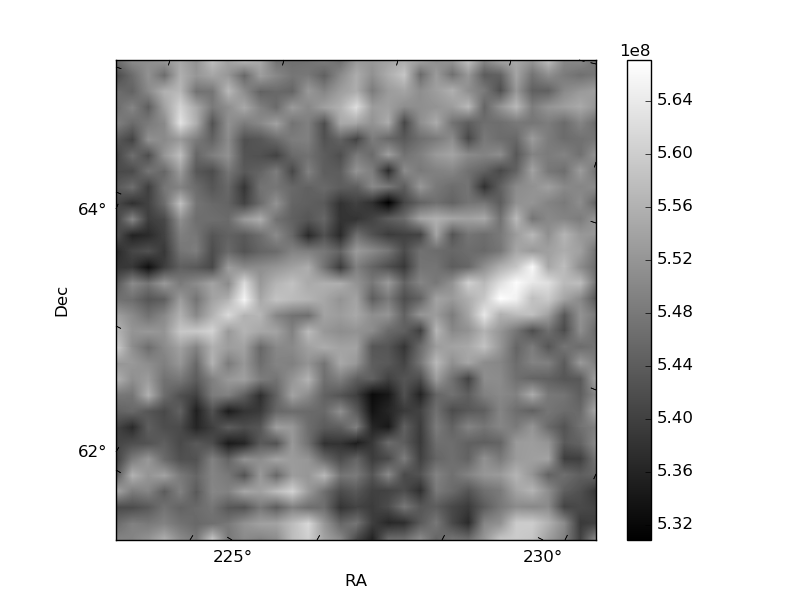
Histogram calculated using DETX and DETY for each event in the final _common_clean file
| Quadrant A |  |
 |
Quadrant B |
|---|---|---|---|
| Quadrant D | 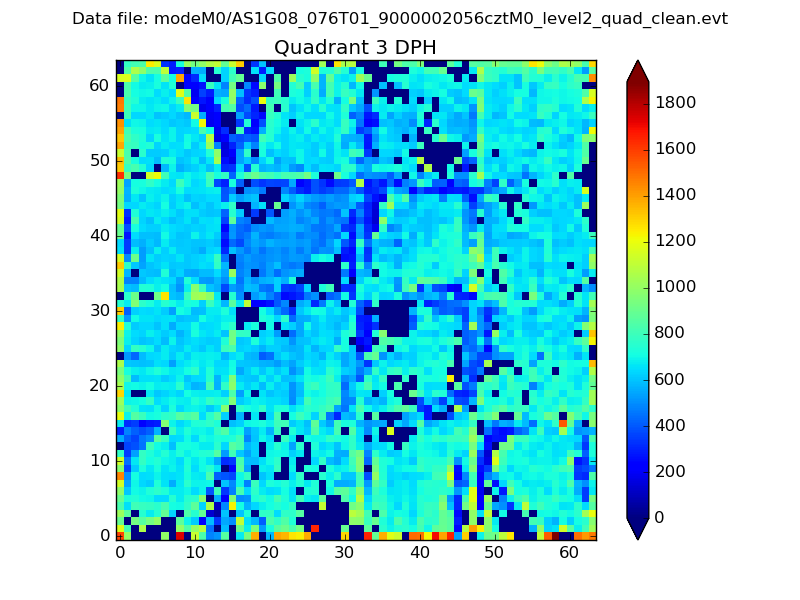 |
 |
Quadrant C |
| Plot type | Count rate plots | Images |
|---|---|---|
| Comparison with Poisson distribution Blue bars denote a histogram of data divided into 1 sec bins. Red curve is a Poisson curve with rate = median count rate of data. |
 |
 |
| Quadrant-wise count rates Data is divided into 100 sec bins |
 |
|
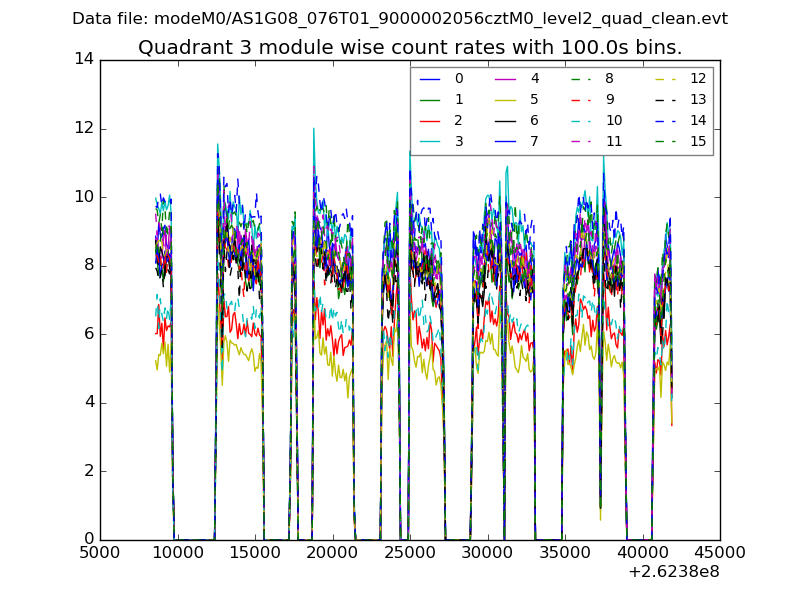
| Module-wise count rates for Quadrant A Data is divided into 100 sec bins |
 |
 |
| Module-wise count rates for Quadrant B Data is divided into 100 sec bins |
 |
 |
| Module-wise count rates for Quadrant C Data is divided into 100 sec bins |
 |
 |
| Module-wise count rates for Quadrant D Data is divided into 100 sec bins |
 |
 |
| Parameter | Plot |
|---|---|
| CZT HV Monitor |  |
| D_VDD |  |
| Temperature 1 |  |
| Veto HV Monitor |  |
| Veto LLD |  |
| Alpha Counter | 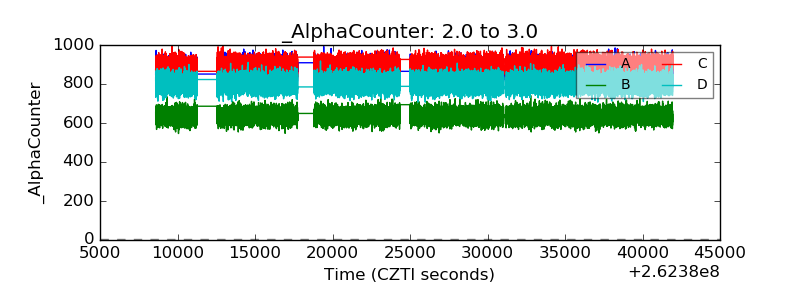 |
| _CPM_Rate | 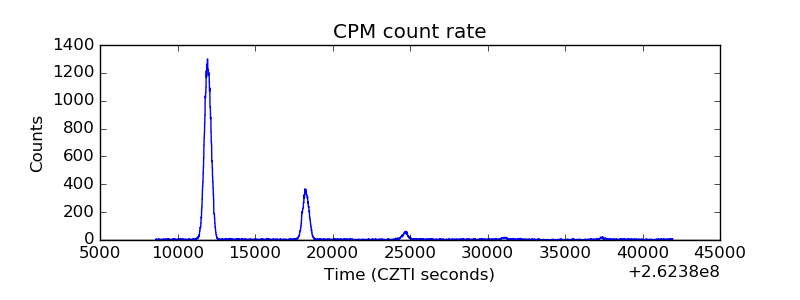 |
| CZT Counter |  |
| +2.5 Volts monitor |  |
| +5 Volts monitor | 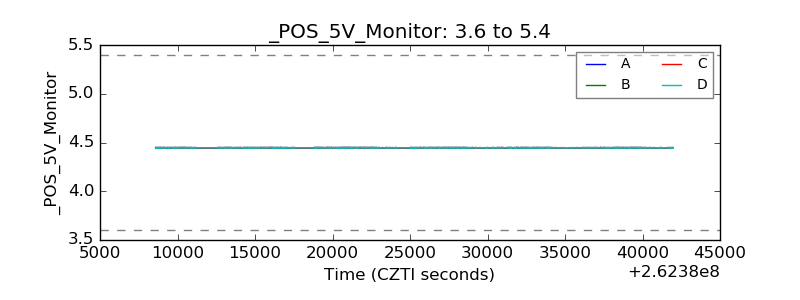 |
| _ROLL_ROT |  |
| _Roll_DEC | 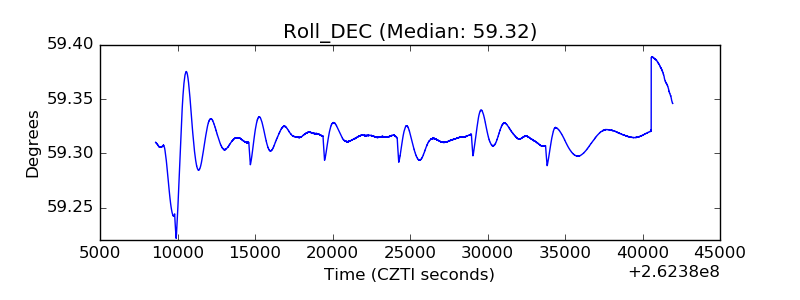 |
| _Roll_RA |  |
| Veto Counter |  |