| Param | Original file | Final file |
|---|---|---|
| Filename | modeM0/AS1A04_167T05_9000002052cztM0_level2_bc.evt | modeM0/AS1A04_167T05_9000002052cztM0_level2_quad_clean.evt |
| Size (bytes) | 229,043,520 | 86,186,880 |
| Size | 218.4 MB | 82.2 MB |
| Events in quadrant A | 1,344,116 | 539,629 |
| Events in quadrant B | 1,397,414 | 545,087 |
| Events in quadrant C | 1,332,980 | 542,218 |
| Events in quadrant D | 2,404,789 | 523,197 |
| Mode M0 | |||
|---|---|---|---|
| Quadrant | BADHDUFLAG | Total packets | Discarded packets |
| A | 0 | 13744 | 0 |
| B | 0 | 13803 | 0 |
| C | 0 | 13478 | 0 |
| D | 0 | 16970 | 0 |
| Mode SS | |||
|---|---|---|---|
| Quadrant | BADHDUFLAG | Total packets | Discarded packets |
| A | 0 | 134 | 0 |
| B | 0 | 134 | 0 |
| C | 0 | 134 | 0 |
| D | 0 | 134 | 0 |
| Mode M9 | |||
|---|---|---|---|
| Quadrant | BADHDUFLAG | Total packets | Discarded packets |
| A | 0 | 8 | 0 |
| B | 0 | 8 | 0 |
| C | 0 | 8 | 0 |
| D | 0 | 8 | 0 |
| Quadrant | Total seconds | Saturated seconds | Saturation percentage |
|---|---|---|---|
| A | 6603 | 116 | 1.756777% |
| B | 6603 | 117 | 1.771922% |
| C | 6603 | 88 | 1.332728% |
| D | 6603 | 147 | 2.226261% |
Noise dominated data is calculated using 1-second bins in cleaned event files. If a bin has >2000 counts, and if more than 50% of those come from <1% of pixels, then it is considered to be noise-dominated and hence unusable.
| Quadrant | # 1 sec bins | Bins with >0 counts | Bins with >2000 counts | High rate bins dominated by noise | Noise dominated (total time) | Noise dominated (detector-on time) | Marked lightcurve |
|---|---|---|---|---|---|---|---|
| A | 7263 | 6602 | 0 | 0 | 0.00% | 0.00% | 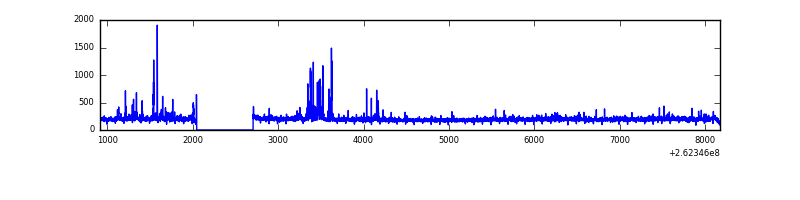 |
| B | 7263 | 6602 | 0 | 0 | 0.00% | 0.00% |  |
| C | 7263 | 6602 | 0 | 0 | 0.00% | 0.00% |  |
| D | 7263 | 6602 | 3 | 3 | 0.04% | 0.05% |  |
Top three noisy pixels from each quadrant. If the there are fewer than three noisy pixels in the level2.evt file, extra rows are filled as -1
| Pixel properties | Quadrant properties | ||||||
|---|---|---|---|---|---|---|---|
| Quadrant | DetID | PixID | Counts | Sigma | Mean | Median | Sigma |
| A | 9 | 143 | 75457 | 1016.58 | 322 | 313 | 73.9 |
| A | 1 | 162 | 13023 | 171.95 | 322 | 313 | 73.9 |
| A | 8 | 15 | 9626 | 125.99 | 322 | 313 | 73.9 |
| B | 12 | 0 | 78050 | 1175.52 | 324 | 314 | 66.1 |
| B | 10 | 244 | 29018 | 434.06 | 324 | 314 | 66.1 |
| B | 4 | 173 | 13851 | 204.71 | 324 | 314 | 66.1 |
| C | 3 | 233 | 81912 | 1089.16 | 319 | 313 | 74.9 |
| C | 13 | 61 | 1862 | 20.68 | 319 | 313 | 74.9 |
| C | 7 | 247 | 947 | 8.46 | 319 | 313 | 74.9 |
| D | 1 | 52 | 490441 | 6296.52 | 316 | 304 | 77.8 |
| D | 13 | 122 | 468721 | 6017.49 | 316 | 304 | 77.8 |
| D | 8 | 195 | 38794 | 494.46 | 316 | 304 | 77.8 |
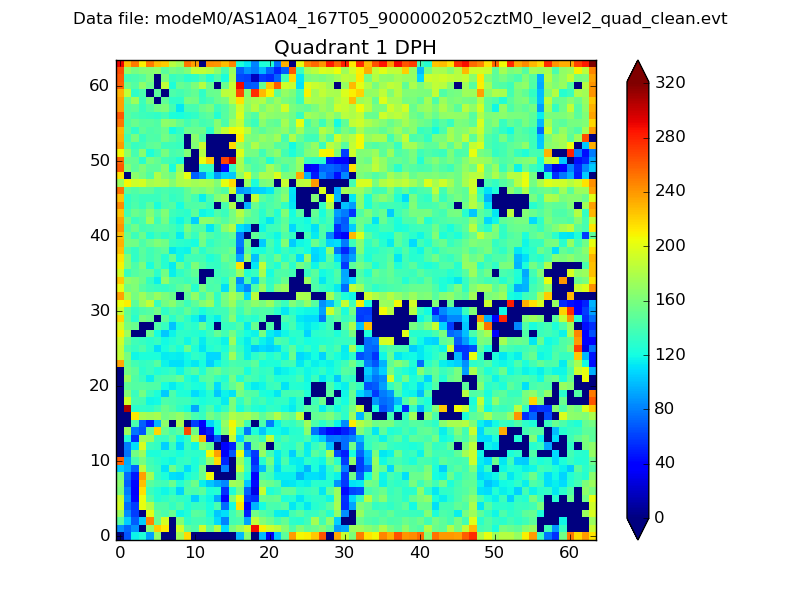
Histogram calculated using DETX and DETY for each event in the final _common_clean file
| Quadrant A |  |
 |
Quadrant B |
|---|---|---|---|
| Quadrant D | 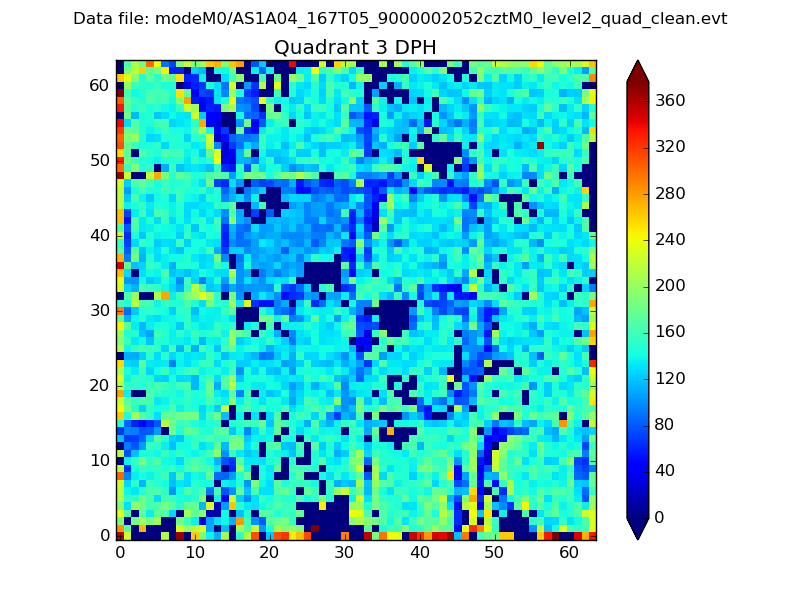 |
 |
Quadrant C |
| Plot type | Count rate plots | Images |
|---|---|---|
| Comparison with Poisson distribution Blue bars denote a histogram of data divided into 1 sec bins. Red curve is a Poisson curve with rate = median count rate of data. |
 |
 |
| Quadrant-wise count rates Data is divided into 100 sec bins |
 |
|
| Module-wise count rates for Quadrant A Data is divided into 100 sec bins |
 |
 |
| Module-wise count rates for Quadrant B Data is divided into 100 sec bins |
 |
 |
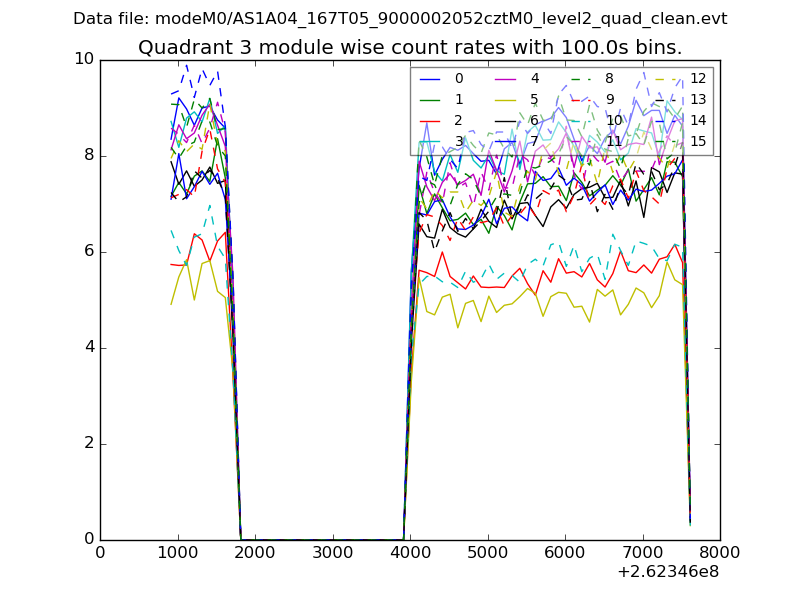
| Module-wise count rates for Quadrant C Data is divided into 100 sec bins |
 |
 |
| Module-wise count rates for Quadrant D Data is divided into 100 sec bins |
 |
 |
| Parameter | Plot |
|---|---|
| CZT HV Monitor |  |
| D_VDD |  |
| Temperature 1 | 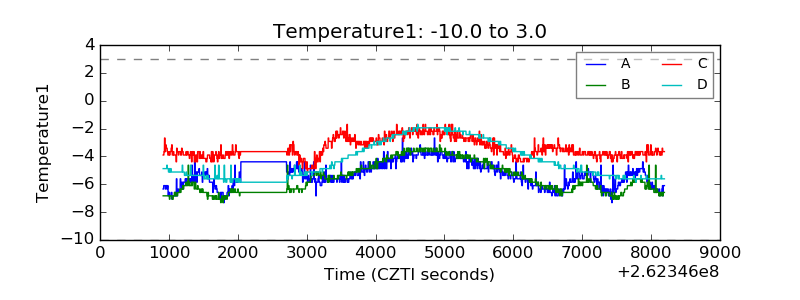 |
| Veto HV Monitor |  |
| Veto LLD | 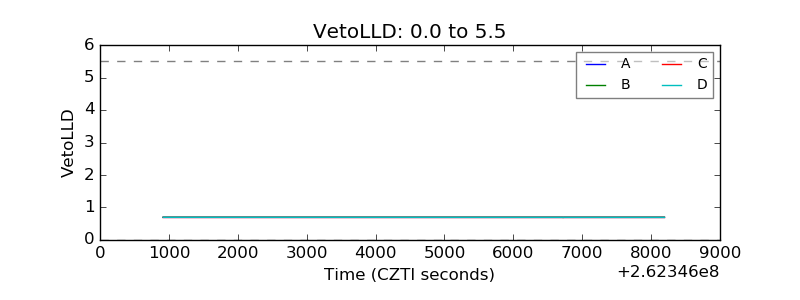 |
| Alpha Counter |  |
| _CPM_Rate |  |
| CZT Counter | 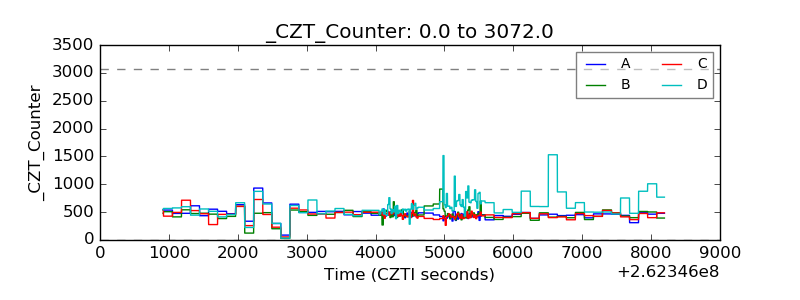 |
| +2.5 Volts monitor |  |
| +5 Volts monitor |  |
| _ROLL_ROT |  |
| _Roll_DEC | 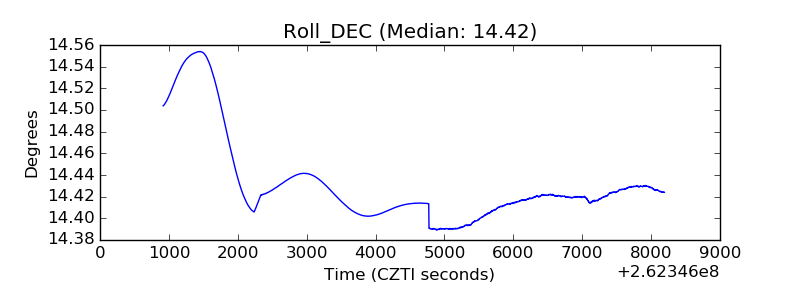 |
| _Roll_RA |  |
| Veto Counter | 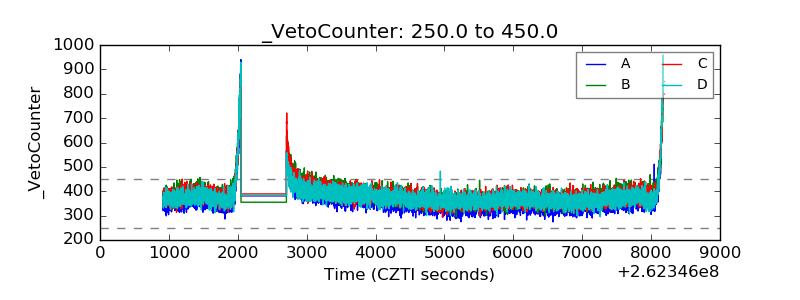 |