| Param | Original file | Final file |
|---|---|---|
| Filename | modeM0/AS1A04_012T02_9000002050cztM0_level2_bc.evt | modeM0/AS1A04_012T02_9000002050cztM0_level2_quad_clean.evt |
| Size (bytes) | 1,828,028,160 | 567,786,240 |
| Size | 1.7 GB | 541.5 MB |
| Events in quadrant A | 10,975,792 | 3,517,445 |
| Events in quadrant B | 9,818,034 | 3,583,306 |
| Events in quadrant C | 9,942,501 | 3,555,067 |
| Events in quadrant D | 21,430,068 | 3,323,819 |
| Mode M0 | |||
|---|---|---|---|
| Quadrant | BADHDUFLAG | Total packets | Discarded packets |
| A | 0 | 102763 | 0 |
| B | 0 | 98660 | 0 |
| C | 0 | 96958 | 0 |
| D | 0 | 139070 | 0 |
| Mode SS | |||
|---|---|---|---|
| Quadrant | BADHDUFLAG | Total packets | Discarded packets |
| A | 0 | 948 | 0 |
| B | 0 | 948 | 0 |
| C | 0 | 948 | 0 |
| D | 0 | 948 | 0 |
| Mode M9 | |||
|---|---|---|---|
| Quadrant | BADHDUFLAG | Total packets | Discarded packets |
| A | 0 | 62 | 0 |
| B | 0 | 62 | 0 |
| C | 0 | 62 | 0 |
| D | 0 | 62 | 0 |
| Quadrant | Total seconds | Saturated seconds | Saturation percentage |
|---|---|---|---|
| A | 46886 | 953 | 2.032590% |
| B | 46886 | 743 | 1.584695% |
| C | 46886 | 410 | 0.874461% |
| D | 46886 | 2816 | 6.006057% |
Noise dominated data is calculated using 1-second bins in cleaned event files. If a bin has >2000 counts, and if more than 50% of those come from <1% of pixels, then it is considered to be noise-dominated and hence unusable.
| Quadrant | # 1 sec bins | Bins with >0 counts | Bins with >2000 counts | High rate bins dominated by noise | Noise dominated (total time) | Noise dominated (detector-on time) | Marked lightcurve |
|---|---|---|---|---|---|---|---|
| A | 52872 | 46886 | 20 | 20 | 0.04% | 0.04% |  |
| B | 52872 | 46884 | 5 | 5 | 0.01% | 0.01% | 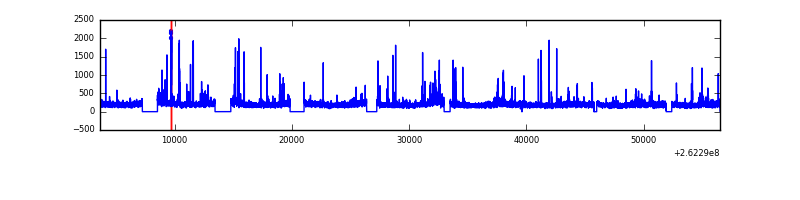 |
| C | 52872 | 46885 | 0 | 0 | 0.00% | 0.00% |  |
| D | 52872 | 46884 | 238 | 238 | 0.45% | 0.51% | 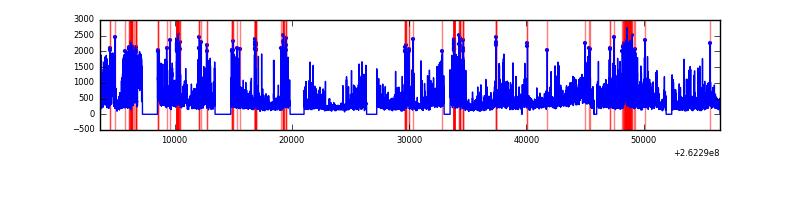 |
Top three noisy pixels from each quadrant. If the there are fewer than three noisy pixels in the level2.evt file, extra rows are filled as -1
| Pixel properties | Quadrant properties | ||||||
|---|---|---|---|---|---|---|---|
| Quadrant | DetID | PixID | Counts | Sigma | Mean | Median | Sigma |
| A | 9 | 143 | 1649707 | 3179.26 | 2356 | 2300 | 518.2 |
| A | 8 | 15 | 170431 | 324.47 | 2356 | 2300 | 518.2 |
| A | 1 | 162 | 68790 | 128.32 | 2356 | 2300 | 518.2 |
| B | 10 | 244 | 140829 | 307.7 | 2386 | 2323 | 450.1 |
| B | 4 | 142 | 114348 | 248.87 | 2386 | 2323 | 450.1 |
| B | 4 | 80 | 101674 | 220.72 | 2386 | 2323 | 450.1 |
| C | 3 | 233 | 754587 | 1434.45 | 2348 | 2308 | 524.4 |
| C | 13 | 61 | 13984 | 22.26 | 2348 | 2308 | 524.4 |
| C | 12 | 4 | 8343 | 11.51 | 2348 | 2308 | 524.4 |
| D | 13 | 122 | 8520139 | 15954.74 | 2271 | 2202 | 533.9 |
| D | 1 | 52 | 2166301 | 4053.52 | 2271 | 2202 | 533.9 |
| D | 5 | 222 | 765072 | 1428.91 | 2271 | 2202 | 533.9 |
Histogram calculated using DETX and DETY for each event in the final _common_clean file
| Quadrant A | 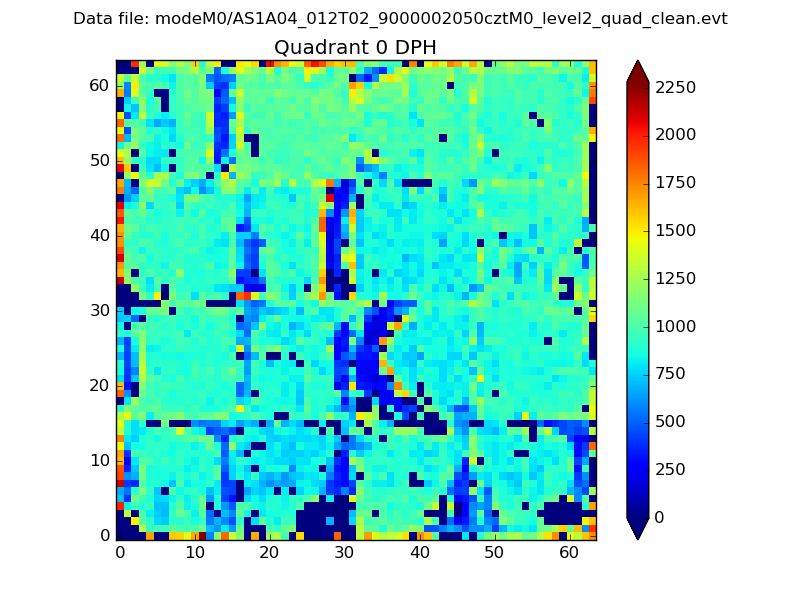 |
 |
Quadrant B |
|---|---|---|---|
| Quadrant D |  |
 |
Quadrant C |
| Plot type | Count rate plots | Images |
|---|---|---|
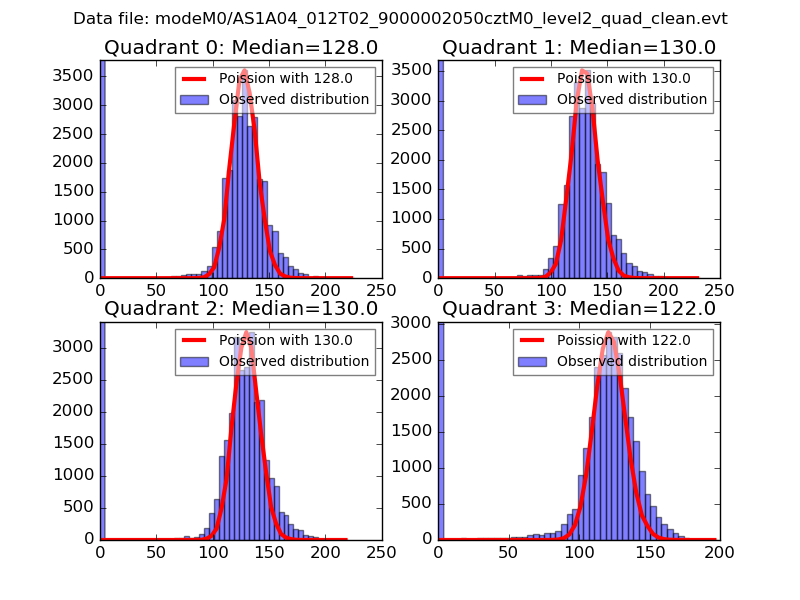
| Comparison with Poisson distribution Blue bars denote a histogram of data divided into 1 sec bins. Red curve is a Poisson curve with rate = median count rate of data. |
 |
 |
| Quadrant-wise count rates Data is divided into 100 sec bins |
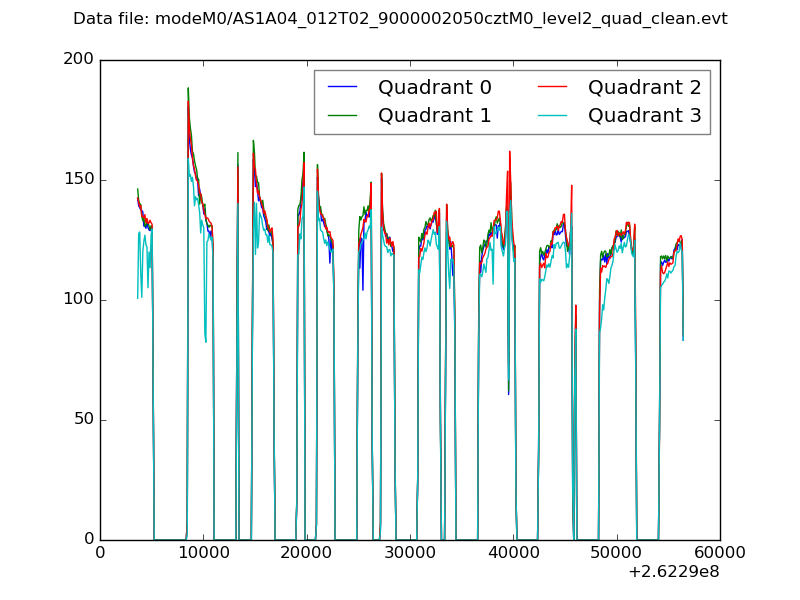 |
|
| Module-wise count rates for Quadrant A Data is divided into 100 sec bins |
 |
 |
| Module-wise count rates for Quadrant B Data is divided into 100 sec bins |
 |
 |
| Module-wise count rates for Quadrant C Data is divided into 100 sec bins |
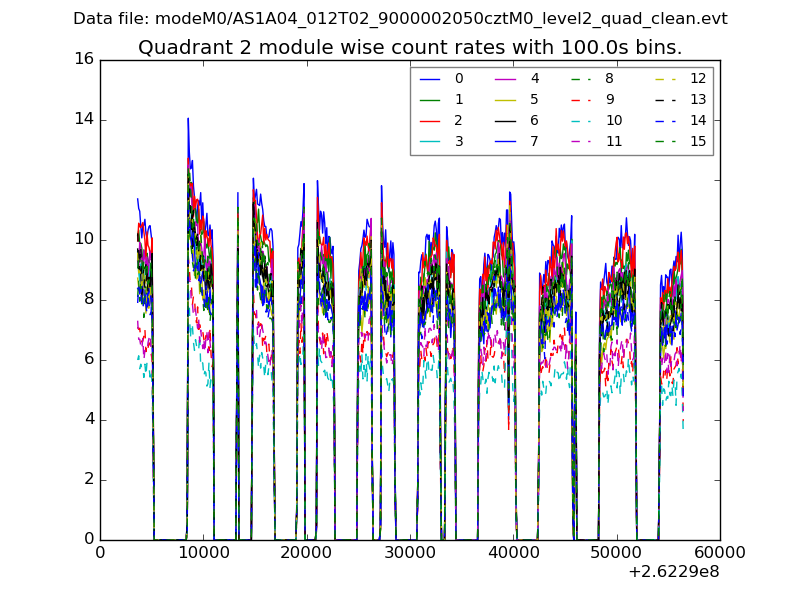 |
 |
| Module-wise count rates for Quadrant D Data is divided into 100 sec bins |
 |
 |
| Parameter | Plot |
|---|---|
| CZT HV Monitor |  |
| D_VDD |  |
| Temperature 1 | 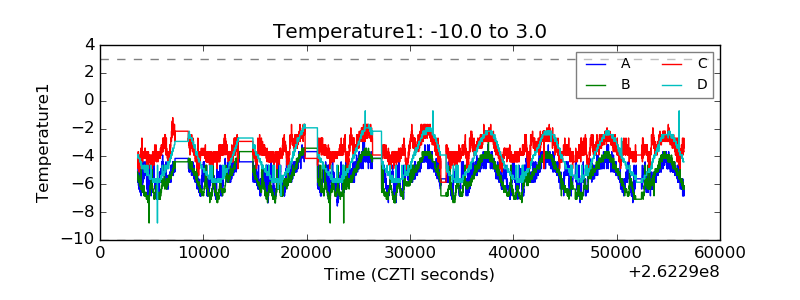 |
| Veto HV Monitor |  |
| Veto LLD |  |
| Alpha Counter |  |
| _CPM_Rate |  |
| CZT Counter |  |
| +2.5 Volts monitor |  |
| +5 Volts monitor |  |
| _ROLL_ROT |  |
| _Roll_DEC |  |
| _Roll_RA |  |
| Veto Counter |  |