| Param | Original file | Final file |
|---|---|---|
| Filename | modeM0/AS1A04_010T02_9000002048cztM0_level2_bc.evt | modeM0/AS1A04_010T02_9000002048cztM0_level2_quad_clean.evt |
| Size (bytes) | 3,001,749,120 | 919,221,120 |
| Size | 2.8 GB | 876.6 MB |
| Events in quadrant A | 16,403,452 | 5,920,574 |
| Events in quadrant B | 16,073,986 | 5,977,804 |
| Events in quadrant C | 16,278,096 | 5,909,172 |
| Events in quadrant D | 37,044,286 | 4,895,211 |
| Mode SS | |||
|---|---|---|---|
| Quadrant | BADHDUFLAG | Total packets | Discarded packets |
| A | 0 | 1532 | 0 |
| B | 0 | 1532 | 0 |
| C | 0 | 1532 | 0 |
| D | 0 | 1532 | 0 |
| Mode M9 | |||
|---|---|---|---|
| Quadrant | BADHDUFLAG | Total packets | Discarded packets |
| A | 0 | 117 | 0 |
| B | 0 | 117 | 0 |
| C | 0 | 117 | 0 |
| D | 0 | 117 | 0 |
| Mode M0 | |||
|---|---|---|---|
| Quadrant | BADHDUFLAG | Total packets | Discarded packets |
| A | 0 | 159893 | 0 |
| B | 0 | 158296 | 0 |
| C | 0 | 155500 | 0 |
| D | 0 | 261200 | 0 |
| Quadrant | Total seconds | Saturated seconds | Saturation percentage |
|---|---|---|---|
| A | 74879 | 1383 | 1.846980% |
| B | 74879 | 1294 | 1.728121% |
| C | 74879 | 732 | 0.977577% |
| D | 74879 | 13254 | 17.700557% |
Noise dominated data is calculated using 1-second bins in cleaned event files. If a bin has >2000 counts, and if more than 50% of those come from <1% of pixels, then it is considered to be noise-dominated and hence unusable.
| Quadrant | # 1 sec bins | Bins with >0 counts | Bins with >2000 counts | High rate bins dominated by noise | Noise dominated (total time) | Noise dominated (detector-on time) | Marked lightcurve |
|---|---|---|---|---|---|---|---|
| A | 86910 | 74872 | 61 | 61 | 0.07% | 0.08% |  |
| B | 86910 | 74873 | 37 | 37 | 0.04% | 0.05% |  |
| C | 86910 | 74873 | 0 | 0 | 0.00% | 0.00% | 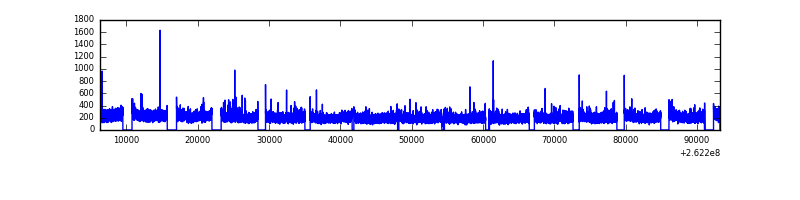 |
| D | 86910 | 74862 | 647 | 647 | 0.74% | 0.86% |  |
Top three noisy pixels from each quadrant. If the there are fewer than three noisy pixels in the level2.evt file, extra rows are filled as -1
| Pixel properties | Quadrant properties | ||||||
|---|---|---|---|---|---|---|---|
| Quadrant | DetID | PixID | Counts | Sigma | Mean | Median | Sigma |
| A | 9 | 143 | 1098954 | 1331.37 | 3800 | 3723 | 822.6 |
| A | 8 | 15 | 277794 | 333.16 | 3800 | 3723 | 822.6 |
| A | 1 | 162 | 122673 | 144.6 | 3800 | 3723 | 822.6 |
| B | 10 | 244 | 362348 | 497.93 | 3831 | 3724 | 720.2 |
| B | 4 | 80 | 335600 | 460.79 | 3831 | 3724 | 720.2 |
| B | 4 | 173 | 179511 | 244.07 | 3831 | 3724 | 720.2 |
| C | 3 | 233 | 1513213 | 1810.38 | 3761 | 3693 | 833.8 |
| C | 13 | 61 | 21801 | 21.72 | 3761 | 3693 | 833.8 |
| C | 12 | 4 | 17928 | 17.07 | 3761 | 3693 | 833.8 |
| D | 13 | 122 | 16338676 | 20824.06 | 3335 | 3230 | 784.5 |
| D | 1 | 52 | 4443175 | 5659.94 | 3335 | 3230 | 784.5 |
| D | 5 | 222 | 1113949 | 1415.92 | 3335 | 3230 | 784.5 |
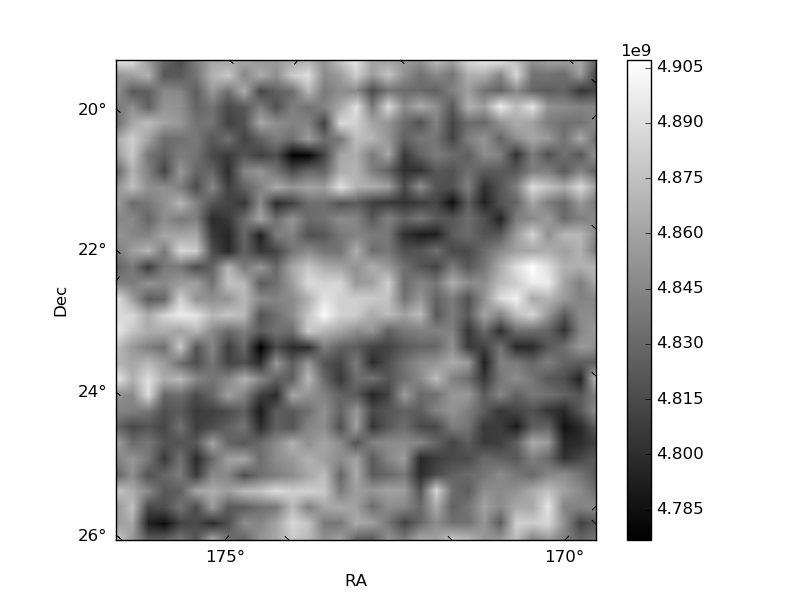
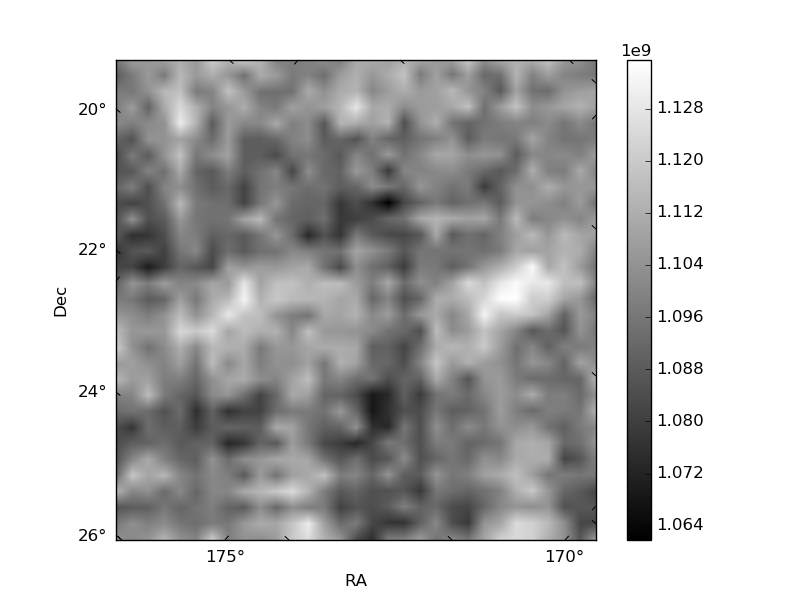
Histogram calculated using DETX and DETY for each event in the final _common_clean file
| Quadrant A |  |
 |
Quadrant B |
|---|---|---|---|
| Quadrant D |  |
 |
Quadrant C |
| Plot type | Count rate plots | Images |
|---|---|---|
| Comparison with Poisson distribution Blue bars denote a histogram of data divided into 1 sec bins. Red curve is a Poisson curve with rate = median count rate of data. |
 |
 |
| Quadrant-wise count rates Data is divided into 100 sec bins |
 |
|
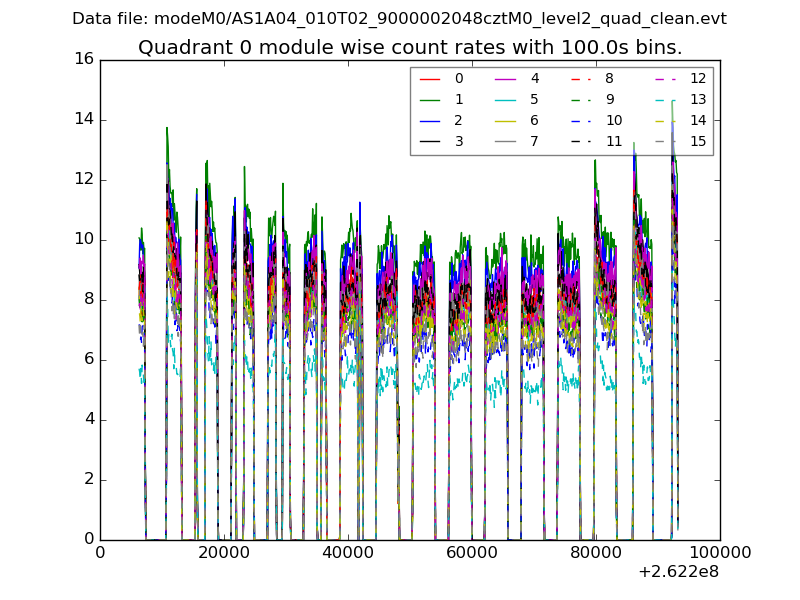
| Module-wise count rates for Quadrant A Data is divided into 100 sec bins |
 |
 |
| Module-wise count rates for Quadrant B Data is divided into 100 sec bins |
 |
 |
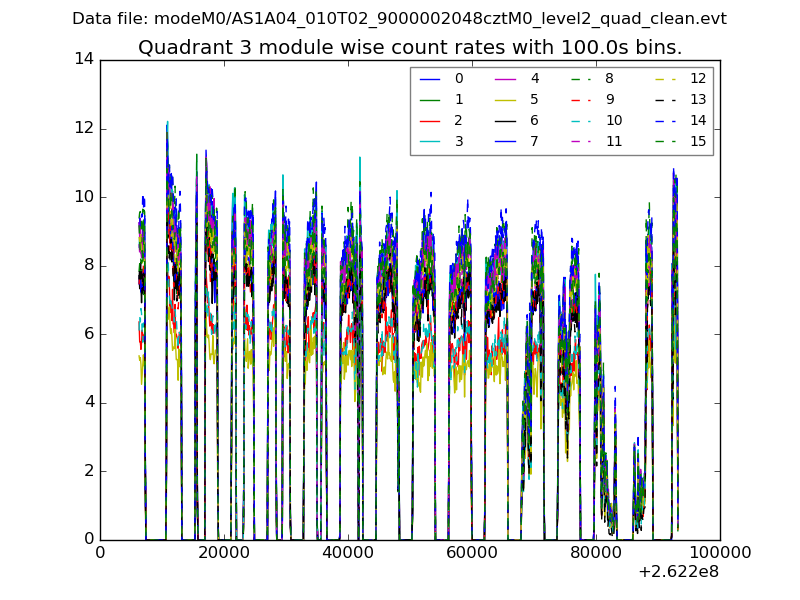
| Module-wise count rates for Quadrant C Data is divided into 100 sec bins |
 |
 |
| Module-wise count rates for Quadrant D Data is divided into 100 sec bins |
 |
 |
| Parameter | Plot |
|---|---|
| CZT HV Monitor | 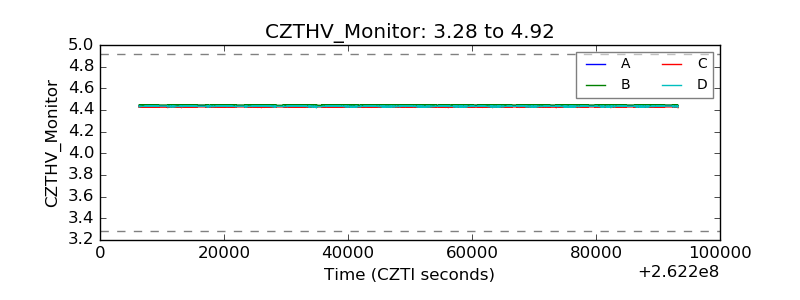 |
| D_VDD |  |
| Temperature 1 |  |
| Veto HV Monitor | 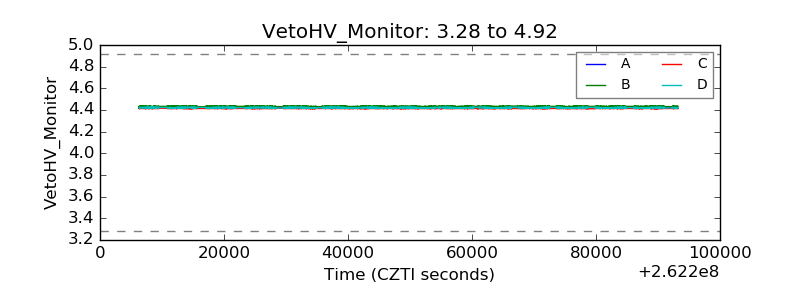 |
| Veto LLD |  |
| Alpha Counter |  |
| _CPM_Rate |  |
| CZT Counter | 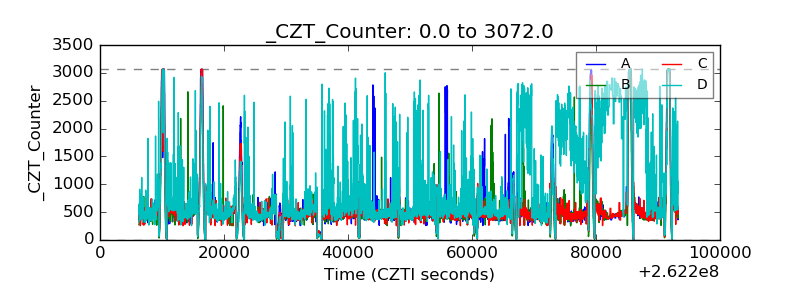 |
| +2.5 Volts monitor |  |
| +5 Volts monitor |  |
| _ROLL_ROT |  |
| _Roll_DEC |  |
| _Roll_RA |  |
| Veto Counter |  |