| Param | Original file | Final file |
|---|---|---|
| Filename | modeM0/AS1G08_030T01_9000002044cztM0_level2_bc.evt | modeM0/AS1G08_030T01_9000002044cztM0_level2_quad_clean.evt |
| Size (bytes) | 702,437,760 | 251,919,360 |
| Size | 669.9 MB | 240.2 MB |
| Events in quadrant A | 4,024,089 | 1,595,230 |
| Events in quadrant B | 4,441,556 | 1,554,584 |
| Events in quadrant C | 4,113,757 | 1,619,913 |
| Events in quadrant D | 7,399,293 | 1,557,620 |
| Mode M9 | |||
|---|---|---|---|
| Quadrant | BADHDUFLAG | Total packets | Discarded packets |
| A | 0 | 37 | 0 |
| B | 0 | 37 | 0 |
| C | 0 | 37 | 0 |
| D | 0 | 37 | 0 |
| Mode M0 | |||
|---|---|---|---|
| Quadrant | BADHDUFLAG | Total packets | Discarded packets |
| A | 0 | 39418 | 0 |
| B | 0 | 40879 | 0 |
| C | 0 | 39230 | 0 |
| D | 0 | 52408 | 0 |
| Mode SS | |||
|---|---|---|---|
| Quadrant | BADHDUFLAG | Total packets | Discarded packets |
| A | 0 | 388 | 0 |
| B | 0 | 388 | 0 |
| C | 0 | 388 | 0 |
| D | 0 | 388 | 0 |
| Quadrant | Total seconds | Saturated seconds | Saturation percentage |
|---|---|---|---|
| A | 18905 | 219 | 1.158424% |
| B | 18905 | 270 | 1.428194% |
| C | 18905 | 176 | 0.930971% |
| D | 18905 | 1054 | 5.575245% |
Noise dominated data is calculated using 1-second bins in cleaned event files. If a bin has >2000 counts, and if more than 50% of those come from <1% of pixels, then it is considered to be noise-dominated and hence unusable.
| Quadrant | # 1 sec bins | Bins with >0 counts | Bins with >2000 counts | High rate bins dominated by noise | Noise dominated (total time) | Noise dominated (detector-on time) | Marked lightcurve |
|---|---|---|---|---|---|---|---|
| A | 22681 | 18903 | 0 | 0 | 0.00% | 0.00% |  |
| B | 22681 | 18902 | 4 | 4 | 0.02% | 0.02% |  |
| C | 22681 | 18903 | 0 | 0 | 0.00% | 0.00% |  |
| D | 22681 | 18902 | 48 | 48 | 0.21% | 0.25% | 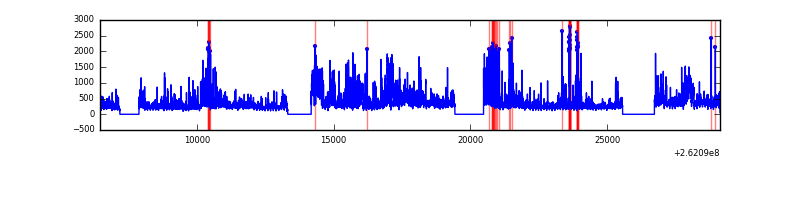 |
Top three noisy pixels from each quadrant. If the there are fewer than three noisy pixels in the level2.evt file, extra rows are filled as -1
| Pixel properties | Quadrant properties | ||||||
|---|---|---|---|---|---|---|---|
| Quadrant | DetID | PixID | Counts | Sigma | Mean | Median | Sigma |
| A | 4 | 2 | 37188 | 160.57 | 1021 | 1002 | 225.4 |
| A | 0 | 23 | 30423 | 130.55 | 1021 | 1002 | 225.4 |
| A | 1 | 162 | 23765 | 101.01 | 1021 | 1002 | 225.4 |
| B | 3 | 209 | 104222 | 529.4 | 1011 | 985 | 195.0 |
| B | 10 | 245 | 103828 | 527.38 | 1011 | 985 | 195.0 |
| B | 10 | 244 | 90315 | 458.09 | 1011 | 985 | 195.0 |
| C | 3 | 233 | 137905 | 581.41 | 1014 | 997 | 235.5 |
| C | 12 | 4 | 8178 | 30.5 | 1014 | 997 | 235.5 |
| C | 14 | 234 | 6541 | 23.54 | 1014 | 997 | 235.5 |
| D | 13 | 122 | 1529584 | 6173.41 | 994 | 961 | 247.6 |
| D | 5 | 222 | 690137 | 2783.27 | 994 | 961 | 247.6 |
| D | 1 | 52 | 532770 | 2147.73 | 994 | 961 | 247.6 |
Histogram calculated using DETX and DETY for each event in the final _common_clean file
| Quadrant A |  |
 |
Quadrant B |
|---|---|---|---|
| Quadrant D |  |
 |
Quadrant C |
| Plot type | Count rate plots | Images |
|---|---|---|
| Comparison with Poisson distribution Blue bars denote a histogram of data divided into 1 sec bins. Red curve is a Poisson curve with rate = median count rate of data. |
 |
 |
| Quadrant-wise count rates Data is divided into 100 sec bins |
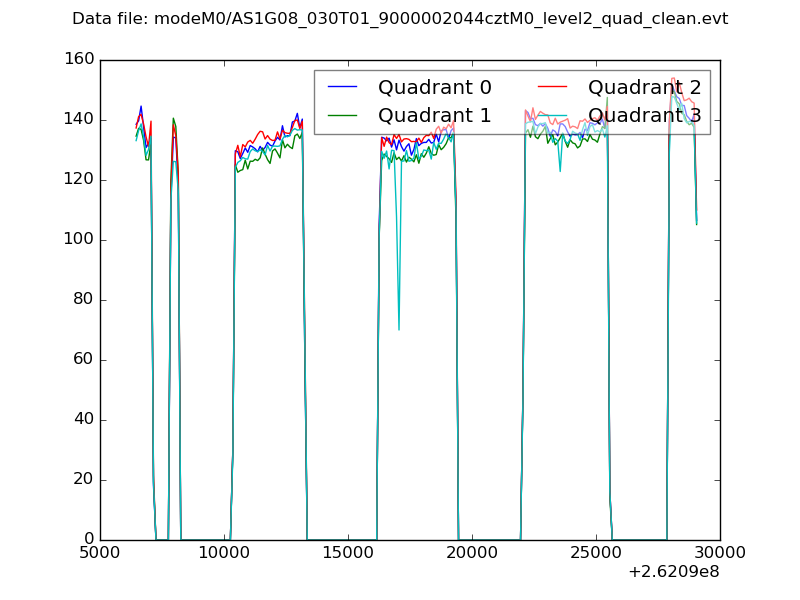 |
|
| Module-wise count rates for Quadrant A Data is divided into 100 sec bins |
 |
 |
| Module-wise count rates for Quadrant B Data is divided into 100 sec bins |
 |
 |
| Module-wise count rates for Quadrant C Data is divided into 100 sec bins |
 |
 |
| Module-wise count rates for Quadrant D Data is divided into 100 sec bins |
 |
 |
| Parameter | Plot |
|---|---|
| CZT HV Monitor |  |
| D_VDD | 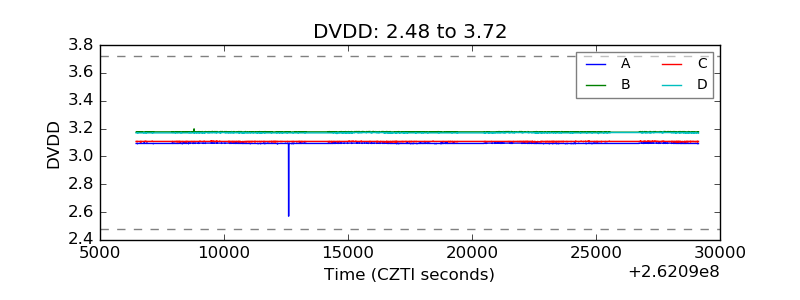 |
| Temperature 1 |  |
| Veto HV Monitor |  |
| Veto LLD |  |
| Alpha Counter | 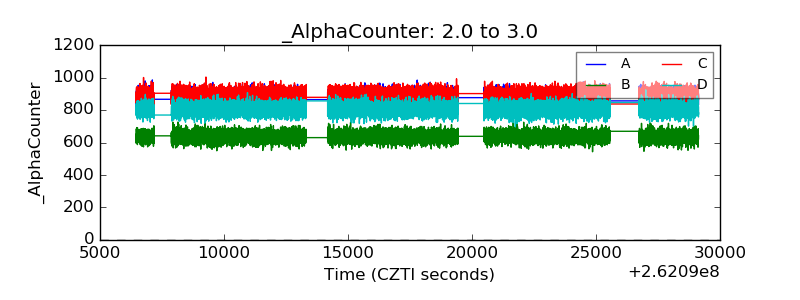 |
| _CPM_Rate |  |
| CZT Counter | 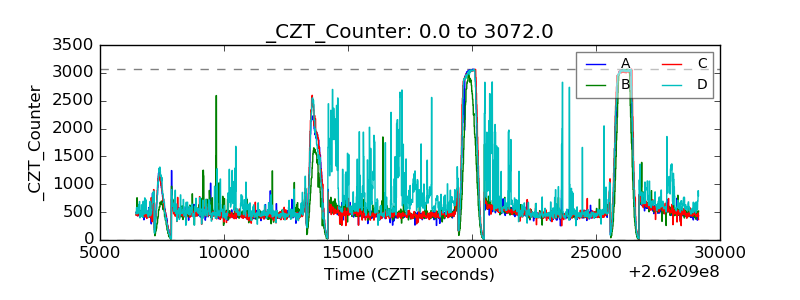 |
| +2.5 Volts monitor | 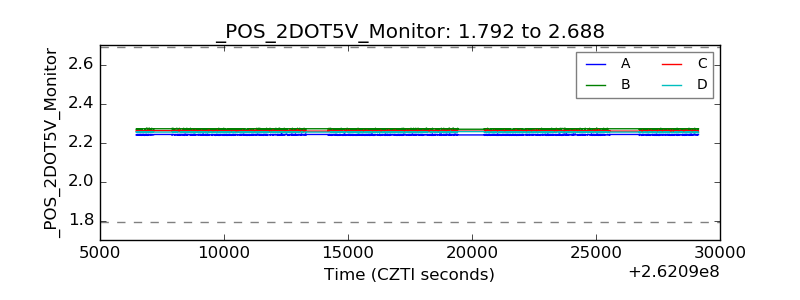 |
| +5 Volts monitor |  |
| _ROLL_ROT | 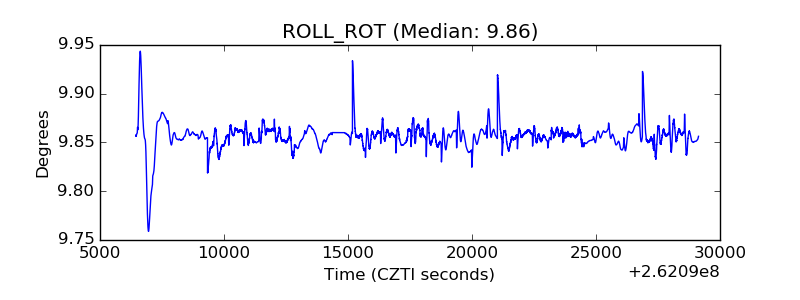 |
| _Roll_DEC |  |
| _Roll_RA |  |
| Veto Counter |  |