| Param | Original file | Final file |
|---|---|---|
| Filename | modeM0/AS1A04_010T01_9000002046cztM0_level2_bc.evt | modeM0/AS1A04_010T01_9000002046cztM0_level2_quad_clean.evt |
| Size (bytes) | 2,892,199,680 | 926,533,440 |
| Size | 2.7 GB | 883.6 MB |
| Events in quadrant A | 16,917,091 | 5,830,484 |
| Events in quadrant B | 15,816,367 | 5,908,567 |
| Events in quadrant C | 16,652,960 | 5,819,270 |
| Events in quadrant D | 33,179,548 | 5,446,541 |
| Mode M9 | |||
|---|---|---|---|
| Quadrant | BADHDUFLAG | Total packets | Discarded packets |
| A | 0 | 119 | 0 |
| B | 0 | 119 | 0 |
| C | 0 | 119 | 0 |
| D | 0 | 119 | 0 |
| Mode M0 | |||
|---|---|---|---|
| Quadrant | BADHDUFLAG | Total packets | Discarded packets |
| A | 0 | 159315 | 0 |
| B | 0 | 155724 | 0 |
| C | 0 | 156576 | 0 |
| D | 0 | 215372 | 0 |
| Mode SS | |||
|---|---|---|---|
| Quadrant | BADHDUFLAG | Total packets | Discarded packets |
| A | 0 | 1504 | 0 |
| B | 0 | 1504 | 0 |
| C | 0 | 1504 | 0 |
| D | 0 | 1504 | 0 |
| Quadrant | Total seconds | Saturated seconds | Saturation percentage |
|---|---|---|---|
| A | 73764 | 1822 | 2.470040% |
| B | 73764 | 1174 | 1.591562% |
| C | 73764 | 1027 | 1.392278% |
| D | 73763 | 4333 | 5.874219% |
Noise dominated data is calculated using 1-second bins in cleaned event files. If a bin has >2000 counts, and if more than 50% of those come from <1% of pixels, then it is considered to be noise-dominated and hence unusable.
| Quadrant | # 1 sec bins | Bins with >0 counts | Bins with >2000 counts | High rate bins dominated by noise | Noise dominated (total time) | Noise dominated (detector-on time) | Marked lightcurve |
|---|---|---|---|---|---|---|---|
| A | 85706 | 73756 | 169 | 169 | 0.20% | 0.23% |  |
| B | 85706 | 73757 | 12 | 12 | 0.01% | 0.02% |  |
| C | 85706 | 73755 | 1 | 1 | 0.00% | 0.00% |  |
| D | 85706 | 73754 | 698 | 698 | 0.81% | 0.95% |  |
Top three noisy pixels from each quadrant. If the there are fewer than three noisy pixels in the level2.evt file, extra rows are filled as -1
| Pixel properties | Quadrant properties | ||||||
|---|---|---|---|---|---|---|---|
| Quadrant | DetID | PixID | Counts | Sigma | Mean | Median | Sigma |
| A | 0 | 23 | 2126395 | 2615.28 | 3747 | 3665 | 811.7 |
| A | 0 | 226 | 149384 | 179.53 | 3747 | 3665 | 811.7 |
| A | 4 | 2 | 91979 | 108.81 | 3747 | 3665 | 811.7 |
| B | 4 | 80 | 364367 | 508.27 | 3788 | 3684 | 709.6 |
| B | 3 | 209 | 189513 | 261.87 | 3788 | 3684 | 709.6 |
| B | 0 | 219 | 167322 | 230.6 | 3788 | 3684 | 709.6 |
| C | 3 | 233 | 2076183 | 2508.99 | 3711 | 3654 | 826.0 |
| C | 0 | 207 | 39615 | 43.53 | 3711 | 3654 | 826.0 |
| C | 12 | 4 | 26545 | 27.71 | 3711 | 3654 | 826.0 |
| D | 1 | 52 | 10934932 | 12742.34 | 3626 | 3509 | 857.9 |
| D | 5 | 222 | 2676968 | 3116.35 | 3626 | 3509 | 857.9 |
| D | 8 | 195 | 1438659 | 1672.9 | 3626 | 3509 | 857.9 |
Histogram calculated using DETX and DETY for each event in the final _common_clean file
| Quadrant A | 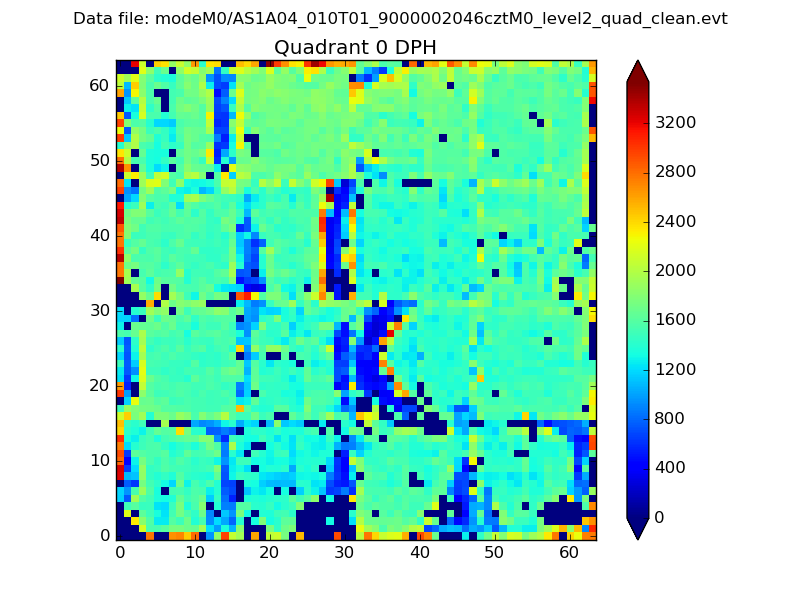 |
 |
Quadrant B |
|---|---|---|---|
| Quadrant D |  |
 |
Quadrant C |
| Plot type | Count rate plots | Images |
|---|---|---|
| Comparison with Poisson distribution Blue bars denote a histogram of data divided into 1 sec bins. Red curve is a Poisson curve with rate = median count rate of data. |
 |
 |
| Quadrant-wise count rates Data is divided into 100 sec bins |
 |
|
| Module-wise count rates for Quadrant A Data is divided into 100 sec bins |
 |
 |
| Module-wise count rates for Quadrant B Data is divided into 100 sec bins |
 |
 |
| Module-wise count rates for Quadrant C Data is divided into 100 sec bins |
 |
 |
| Module-wise count rates for Quadrant D Data is divided into 100 sec bins |
 |
 |
| Parameter | Plot |
|---|---|
| CZT HV Monitor |  |
| D_VDD |  |
| Temperature 1 |  |
| Veto HV Monitor |  |
| Veto LLD | 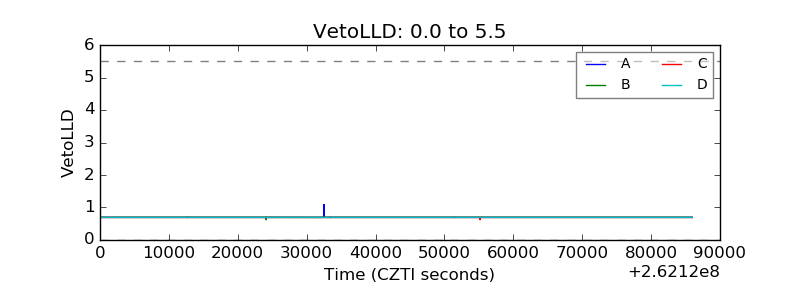 |
| Alpha Counter |  |
| _CPM_Rate |  |
| CZT Counter | 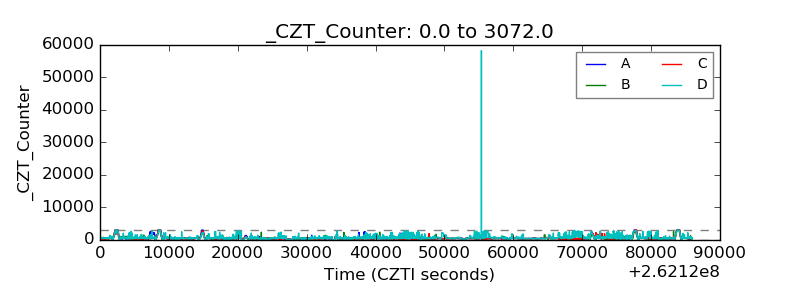 |
| +2.5 Volts monitor |  |
| +5 Volts monitor |  |
| _ROLL_ROT |  |
| _Roll_DEC |  |
| _Roll_RA |  |
| Veto Counter |  |