| Param | Original file | Final file |
|---|---|---|
| Filename | modeM0/AS1A04_115T02_9000002042cztM0_level2_bc.evt | modeM0/AS1A04_115T02_9000002042cztM0_level2_quad_clean.evt |
| Size (bytes) | 3,375,354,240 | 1,160,046,720 |
| Size | 3.1 GB | 1.1 GB |
| Events in quadrant A | 20,715,536 | 7,266,645 |
| Events in quadrant B | 19,559,945 | 7,357,358 |
| Events in quadrant C | 19,240,694 | 7,267,622 |
| Events in quadrant D | 36,413,083 | 6,911,960 |
| Mode SS | |||
|---|---|---|---|
| Quadrant | BADHDUFLAG | Total packets | Discarded packets |
| A | 0 | 1888 | 0 |
| B | 0 | 1888 | 0 |
| C | 0 | 1888 | 0 |
| D | 0 | 1888 | 0 |
| Mode M0 | |||
|---|---|---|---|
| Quadrant | BADHDUFLAG | Total packets | Discarded packets |
| A | 0 | 198453 | 0 |
| B | 0 | 193845 | 0 |
| C | 0 | 191146 | 0 |
| D | 0 | 247576 | 0 |
| Mode M9 | |||
|---|---|---|---|
| Quadrant | BADHDUFLAG | Total packets | Discarded packets |
| A | 0 | 123 | 0 |
| B | 0 | 123 | 0 |
| C | 0 | 123 | 0 |
| D | 0 | 123 | 0 |
| Quadrant | Total seconds | Saturated seconds | Saturation percentage |
|---|---|---|---|
| A | 92392 | 1649 | 1.784787% |
| B | 92392 | 1725 | 1.867045% |
| C | 92392 | 1043 | 1.128886% |
| D | 92392 | 3683 | 3.986276% |
Noise dominated data is calculated using 1-second bins in cleaned event files. If a bin has >2000 counts, and if more than 50% of those come from <1% of pixels, then it is considered to be noise-dominated and hence unusable.
| Quadrant | # 1 sec bins | Bins with >0 counts | Bins with >2000 counts | High rate bins dominated by noise | Noise dominated (total time) | Noise dominated (detector-on time) | Marked lightcurve |
|---|---|---|---|---|---|---|---|
| A | 104789 | 92381 | 69 | 69 | 0.07% | 0.07% |  |
| B | 104789 | 92377 | 8 | 8 | 0.01% | 0.01% |  |
| C | 104789 | 92381 | 6 | 6 | 0.01% | 0.01% |  |
| D | 104789 | 92382 | 706 | 706 | 0.67% | 0.76% |  |
Top three noisy pixels from each quadrant. If the there are fewer than three noisy pixels in the level2.evt file, extra rows are filled as -1
| Pixel properties | Quadrant properties | ||||||
|---|---|---|---|---|---|---|---|
| Quadrant | DetID | PixID | Counts | Sigma | Mean | Median | Sigma |
| A | 0 | 23 | 2537035 | 2453.26 | 4663 | 4553 | 1032.3 |
| A | 0 | 226 | 179131 | 169.12 | 4663 | 4553 | 1032.3 |
| A | 1 | 162 | 97081 | 89.63 | 4663 | 4553 | 1032.3 |
| B | 0 | 214 | 400762 | 439.24 | 4701 | 4557 | 902.0 |
| B | 10 | 244 | 383876 | 420.52 | 4701 | 4557 | 902.0 |
| B | 4 | 80 | 364329 | 398.85 | 4701 | 4557 | 902.0 |
| C | 3 | 233 | 1043538 | 1009.02 | 4614 | 4540 | 1029.7 |
| C | 14 | 220 | 62654 | 56.44 | 4614 | 4540 | 1029.7 |
| C | 14 | 234 | 40037 | 34.47 | 4614 | 4540 | 1029.7 |
| D | 10 | 157 | 10674408 | 10071.68 | 4534 | 4390 | 1059.4 |
| D | 5 | 222 | 3863992 | 3643.17 | 4534 | 4390 | 1059.4 |
| D | 1 | 52 | 1616272 | 1521.49 | 4534 | 4390 | 1059.4 |
Histogram calculated using DETX and DETY for each event in the final _common_clean file
| Quadrant A | 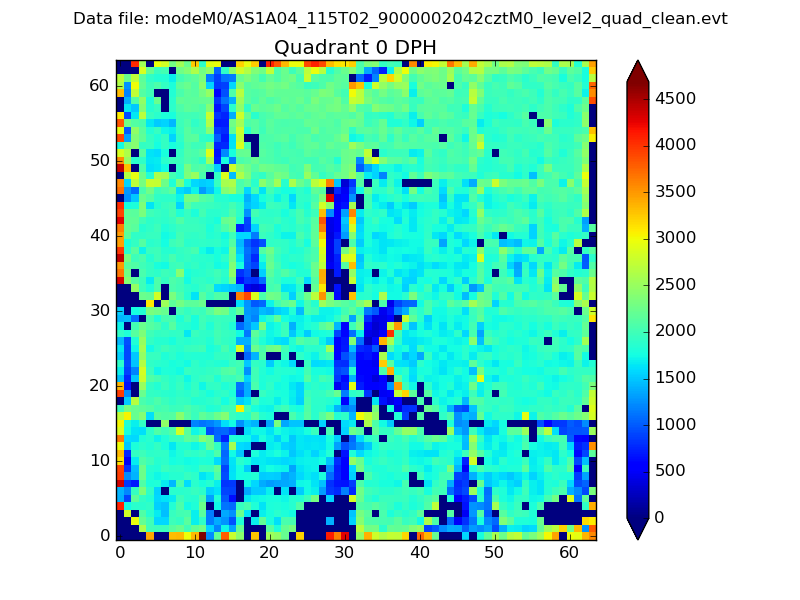 |
 |
Quadrant B |
|---|---|---|---|
| Quadrant D |  |
 |
Quadrant C |
| Plot type | Count rate plots | Images |
|---|---|---|
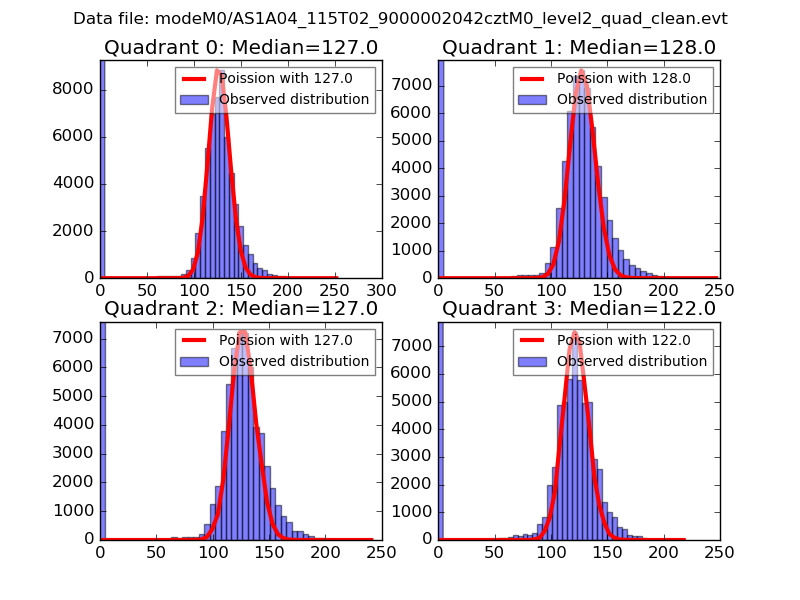
| Comparison with Poisson distribution Blue bars denote a histogram of data divided into 1 sec bins. Red curve is a Poisson curve with rate = median count rate of data. |
 |
 |
| Quadrant-wise count rates Data is divided into 100 sec bins |
 |
|
| Module-wise count rates for Quadrant A Data is divided into 100 sec bins |
 |
 |
| Module-wise count rates for Quadrant B Data is divided into 100 sec bins |
 |
 |
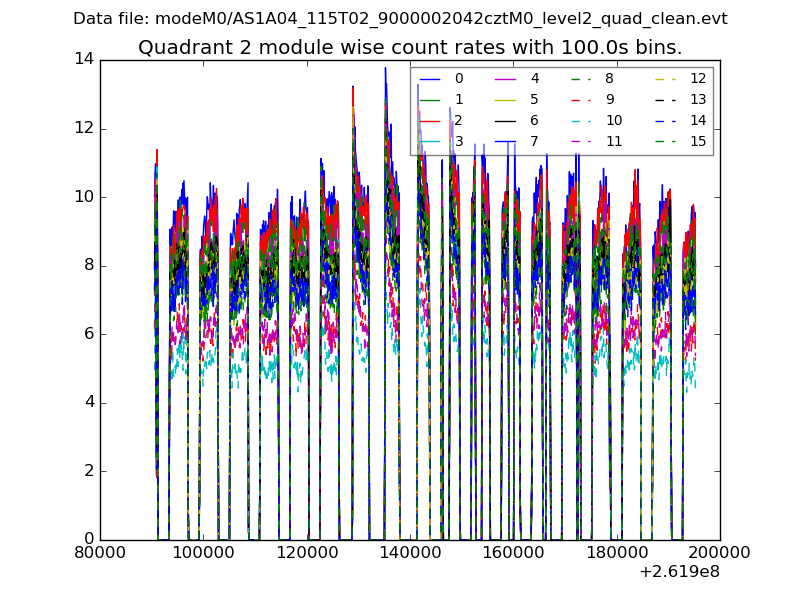
| Module-wise count rates for Quadrant C Data is divided into 100 sec bins |
 |
 |
| Module-wise count rates for Quadrant D Data is divided into 100 sec bins |
 |
 |
| Parameter | Plot |
|---|---|
| CZT HV Monitor | 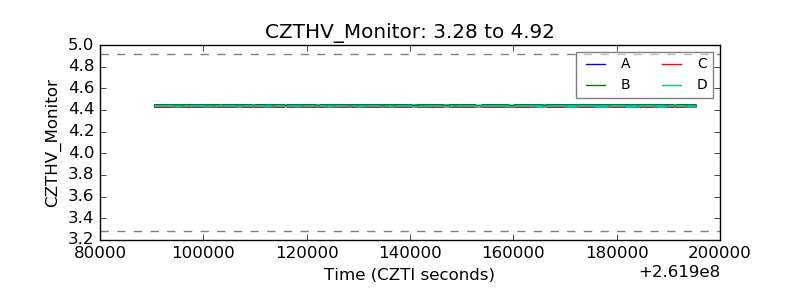 |
| D_VDD |  |
| Temperature 1 |  |
| Veto HV Monitor |  |
| Veto LLD |  |
| Alpha Counter |  |
| _CPM_Rate |  |
| CZT Counter | 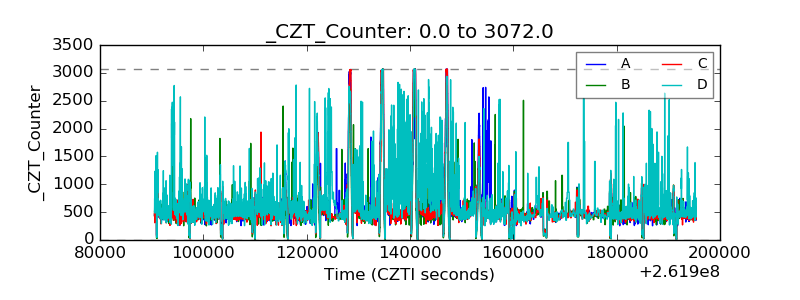 |
| +2.5 Volts monitor |  |
| +5 Volts monitor | 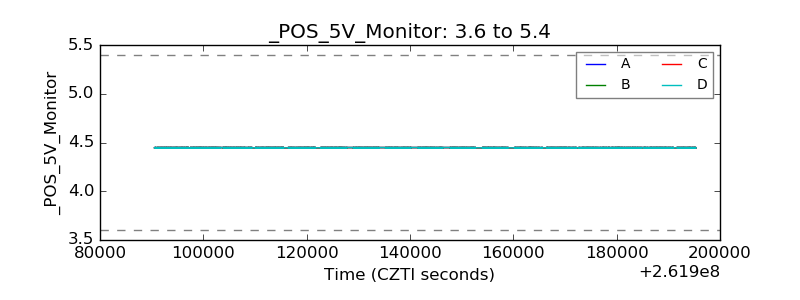 |
| _ROLL_ROT |  |
| _Roll_DEC |  |
| _Roll_RA |  |
| Veto Counter |  |