| Param | Original file | Final file |
|---|---|---|
| Filename | modeM0/AS1G08_062T01_9000002038cztM0_level2_bc.evt | modeM0/AS1G08_062T01_9000002038cztM0_level2_quad_clean.evt |
| Size (bytes) | 8,065,995,840 | 2,905,871,040 |
| Size | 7.5 GB | 2.7 GB |
| Events in quadrant A | 47,315,788 | 18,454,217 |
| Events in quadrant B | 50,889,706 | 18,252,188 |
| Events in quadrant C | 52,579,769 | 19,107,208 |
| Events in quadrant D | 79,529,689 | 18,145,445 |
| Mode M9 | |||
|---|---|---|---|
| Quadrant | BADHDUFLAG | Total packets | Discarded packets |
| A | 0 | 333 | 0 |
| B | 0 | 333 | 0 |
| C | 0 | 333 | 0 |
| D | 0 | 333 | 0 |
| Mode M0 | |||
|---|---|---|---|
| Quadrant | BADHDUFLAG | Total packets | Discarded packets |
| A | 0 | 440299 | 0 |
| B | 0 | 455080 | 0 |
| C | 0 | 452856 | 0 |
| D | 0 | 546173 | 0 |
| Mode SS | |||
|---|---|---|---|
| Quadrant | BADHDUFLAG | Total packets | Discarded packets |
| A | 0 | 4182 | 0 |
| B | 0 | 4182 | 0 |
| C | 0 | 4182 | 0 |
| D | 0 | 4182 | 0 |
| Quadrant | Total seconds | Saturated seconds | Saturation percentage |
|---|---|---|---|
| A | 205292 | 3276 | 1.595776% |
| B | 205292 | 3669 | 1.787210% |
| C | 205292 | 3998 | 1.947470% |
| D | 205292 | 7330 | 3.570524% |
Noise dominated data is calculated using 1-second bins in cleaned event files. If a bin has >2000 counts, and if more than 50% of those come from <1% of pixels, then it is considered to be noise-dominated and hence unusable.
| Quadrant | # 1 sec bins | Bins with >0 counts | Bins with >2000 counts | High rate bins dominated by noise | Noise dominated (total time) | Noise dominated (detector-on time) | Marked lightcurve |
|---|---|---|---|---|---|---|---|
| A | 238803 | 205297 | 232 | 232 | 0.10% | 0.11% |  |
| B | 238803 | 205293 | 157 | 157 | 0.07% | 0.08% |  |
| C | 238803 | 205304 | 294 | 294 | 0.12% | 0.14% |  |
| D | 238803 | 205298 | 523 | 523 | 0.22% | 0.25% |  |
Top three noisy pixels from each quadrant. If the there are fewer than three noisy pixels in the level2.evt file, extra rows are filled as -1
| Pixel properties | Quadrant properties | ||||||
|---|---|---|---|---|---|---|---|
| Quadrant | DetID | PixID | Counts | Sigma | Mean | Median | Sigma |
| A | 9 | 143 | 2526836 | 1050.79 | 10919 | 10716 | 2394.5 |
| A | 0 | 23 | 1567687 | 650.23 | 10919 | 10716 | 2394.5 |
| A | 15 | 69 | 635502 | 260.93 | 10919 | 10716 | 2394.5 |
| B | 0 | 219 | 2602324 | 1271.44 | 10882 | 10630 | 2038.4 |
| B | 3 | 64 | 1151764 | 559.82 | 10882 | 10630 | 2038.4 |
| B | 4 | 173 | 1086377 | 527.74 | 10882 | 10630 | 2038.4 |
| C | 4 | 254 | 4035576 | 1587.05 | 10938 | 10756 | 2536.0 |
| C | 3 | 233 | 3110508 | 1222.28 | 10938 | 10756 | 2536.0 |
| C | 9 | 236 | 2429920 | 953.91 | 10938 | 10756 | 2536.0 |
| D | 5 | 222 | 14384729 | 5118.62 | 10801 | 10400 | 2808.2 |
| D | 1 | 52 | 7878935 | 2801.94 | 10801 | 10400 | 2808.2 |
| D | 13 | 168 | 5933755 | 2109.27 | 10801 | 10400 | 2808.2 |
Histogram calculated using DETX and DETY for each event in the final _common_clean file
| Quadrant A |  |
 |
Quadrant B |
|---|---|---|---|
| Quadrant D |  |
 |
Quadrant C |
| Plot type | Count rate plots | Images |
|---|---|---|
| Comparison with Poisson distribution Blue bars denote a histogram of data divided into 1 sec bins. Red curve is a Poisson curve with rate = median count rate of data. |
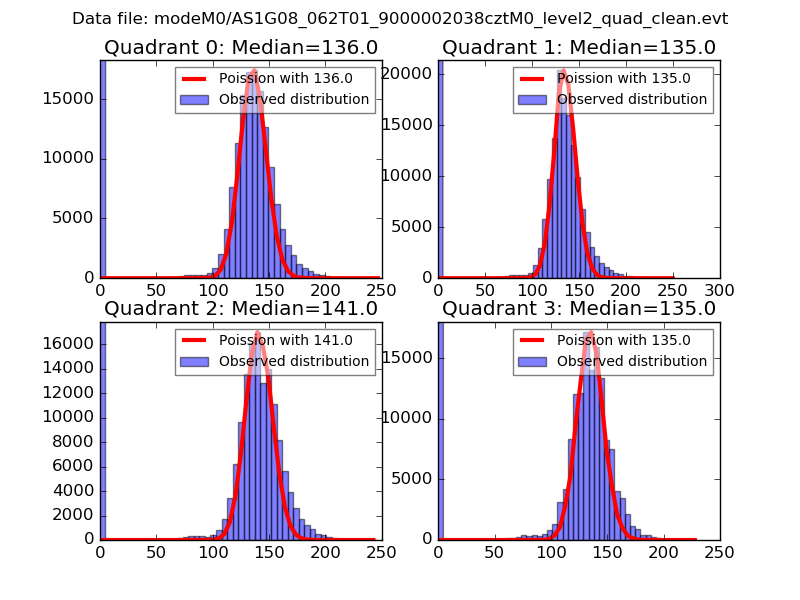 |
 |
| Quadrant-wise count rates Data is divided into 100 sec bins |
 |
|
| Module-wise count rates for Quadrant A Data is divided into 100 sec bins |
 |
 |
| Module-wise count rates for Quadrant B Data is divided into 100 sec bins |
 |
 |
| Module-wise count rates for Quadrant C Data is divided into 100 sec bins |
 |
 |
| Module-wise count rates for Quadrant D Data is divided into 100 sec bins |
 |
 |
| Parameter | Plot |
|---|---|
| CZT HV Monitor |  |
| D_VDD |  |
| Temperature 1 |  |
| Veto HV Monitor |  |
| Veto LLD |  |
| Alpha Counter | 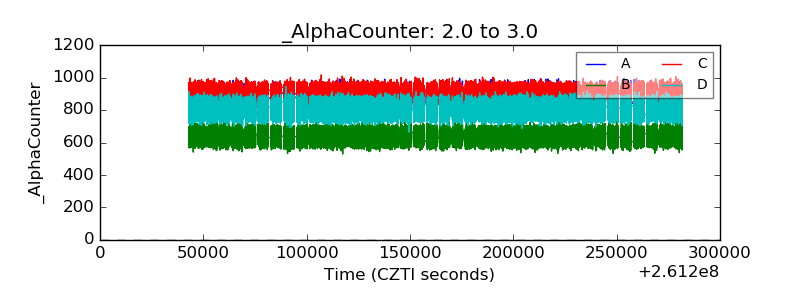 |
| _CPM_Rate |  |
| CZT Counter |  |
| +2.5 Volts monitor |  |
| +5 Volts monitor |  |
| _ROLL_ROT |  |
| _Roll_DEC |  |
| _Roll_RA |  |
| Veto Counter |  |