| Param | Original file | Final file |
|---|---|---|
| Filename | modeM0/AS1G08_039T01_9000002036cztM0_level2_bc.evt | modeM0/AS1G08_039T01_9000002036cztM0_level2_quad_clean.evt |
| Size (bytes) | 751,884,480 | 301,032,000 |
| Size | 717.1 MB | 287.1 MB |
| Events in quadrant A | 4,624,061 | 1,912,826 |
| Events in quadrant B | 5,840,896 | 2,034,190 |
| Events in quadrant C | 5,059,148 | 1,853,109 |
| Events in quadrant D | 5,693,123 | 1,755,247 |
| Mode SS | |||
|---|---|---|---|
| Quadrant | BADHDUFLAG | Total packets | Discarded packets |
| A | 0 | 462 | 0 |
| B | 0 | 462 | 0 |
| C | 0 | 462 | 0 |
| D | 0 | 462 | 0 |
| Mode M9 | |||
|---|---|---|---|
| Quadrant | BADHDUFLAG | Total packets | Discarded packets |
| A | 0 | 13 | 0 |
| B | 0 | 13 | 0 |
| C | 0 | 13 | 0 |
| D | 0 | 13 | 0 |
| Mode M0 | |||
|---|---|---|---|
| Quadrant | BADHDUFLAG | Total packets | Discarded packets |
| A | 0 | 47661 | 0 |
| B | 0 | 50969 | 0 |
| C | 0 | 47859 | 0 |
| D | 0 | 49930 | 0 |
| Quadrant | Total seconds | Saturated seconds | Saturation percentage |
|---|---|---|---|
| A | 22686 | 690 | 3.041523% |
| B | 22686 | 797 | 3.513180% |
| C | 22686 | 502 | 2.212818% |
| D | 22686 | 567 | 2.499339% |
Noise dominated data is calculated using 1-second bins in cleaned event files. If a bin has >2000 counts, and if more than 50% of those come from <1% of pixels, then it is considered to be noise-dominated and hence unusable.
| Quadrant | # 1 sec bins | Bins with >0 counts | Bins with >2000 counts | High rate bins dominated by noise | Noise dominated (total time) | Noise dominated (detector-on time) | Marked lightcurve |
|---|---|---|---|---|---|---|---|
| A | 24097 | 22688 | 3 | 3 | 0.01% | 0.01% |  |
| B | 24097 | 22689 | 21 | 21 | 0.09% | 0.09% |  |
| C | 24097 | 22689 | 2 | 2 | 0.01% | 0.01% | 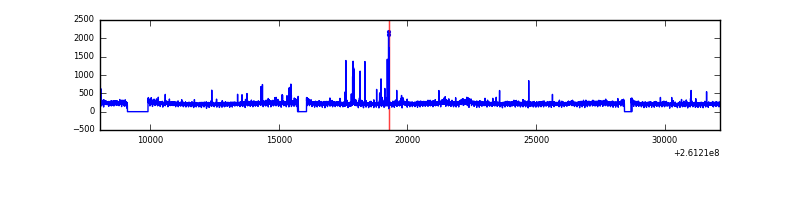 |
| D | 24097 | 22688 | 9 | 9 | 0.04% | 0.04% | 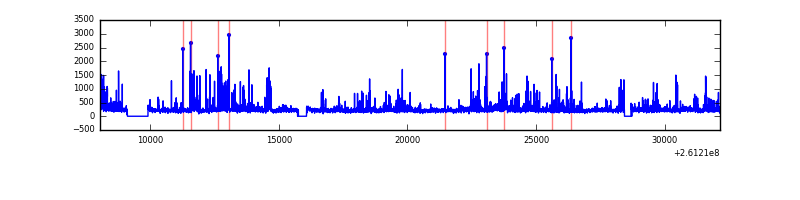 |
Top three noisy pixels from each quadrant. If the there are fewer than three noisy pixels in the level2.evt file, extra rows are filled as -1
| Pixel properties | Quadrant properties | ||||||
|---|---|---|---|---|---|---|---|
| Quadrant | DetID | PixID | Counts | Sigma | Mean | Median | Sigma |
| A | 9 | 143 | 115232 | 434.8 | 1164 | 1132 | 262.4 |
| A | 1 | 162 | 27095 | 98.94 | 1164 | 1132 | 262.4 |
| A | 15 | 69 | 9134 | 30.49 | 1164 | 1132 | 262.4 |
| B | 10 | 244 | 233823 | 965.42 | 1206 | 1170 | 241.0 |
| B | 4 | 48 | 219680 | 906.73 | 1206 | 1170 | 241.0 |
| B | 0 | 219 | 188490 | 777.3 | 1206 | 1170 | 241.0 |
| C | 3 | 233 | 503861 | 1991.18 | 1135 | 1116 | 252.5 |
| C | 4 | 254 | 101594 | 397.95 | 1135 | 1116 | 252.5 |
| C | 13 | 61 | 6825 | 22.61 | 1135 | 1116 | 252.5 |
| D | 5 | 222 | 504392 | 1896.66 | 1131 | 1086 | 265.4 |
| D | 8 | 195 | 358812 | 1348.05 | 1131 | 1086 | 265.4 |
| D | 1 | 52 | 168122 | 629.46 | 1131 | 1086 | 265.4 |
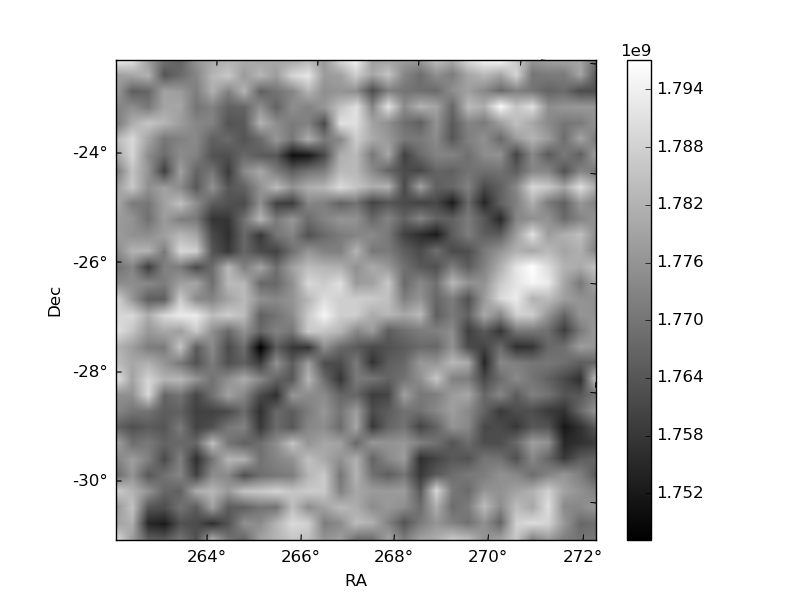
Histogram calculated using DETX and DETY for each event in the final _common_clean file
| Quadrant A | 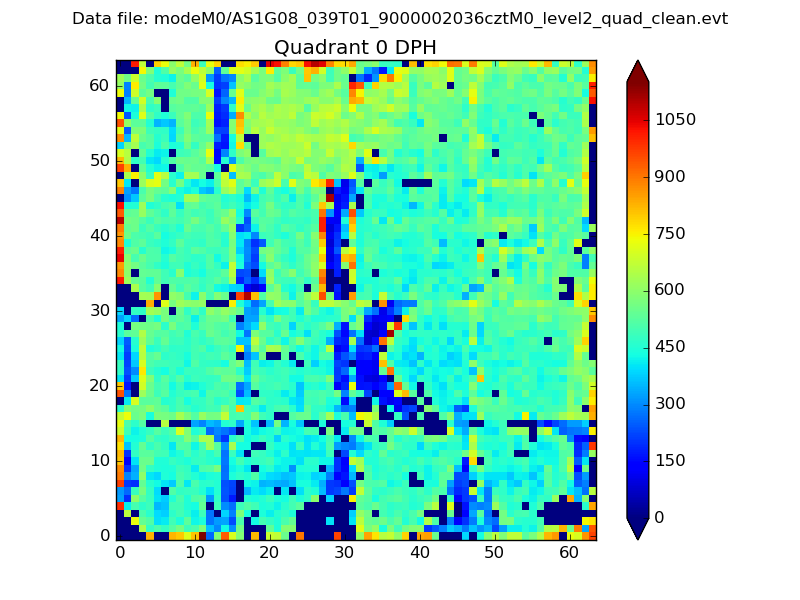 |
 |
Quadrant B |
|---|---|---|---|
| Quadrant D |  |
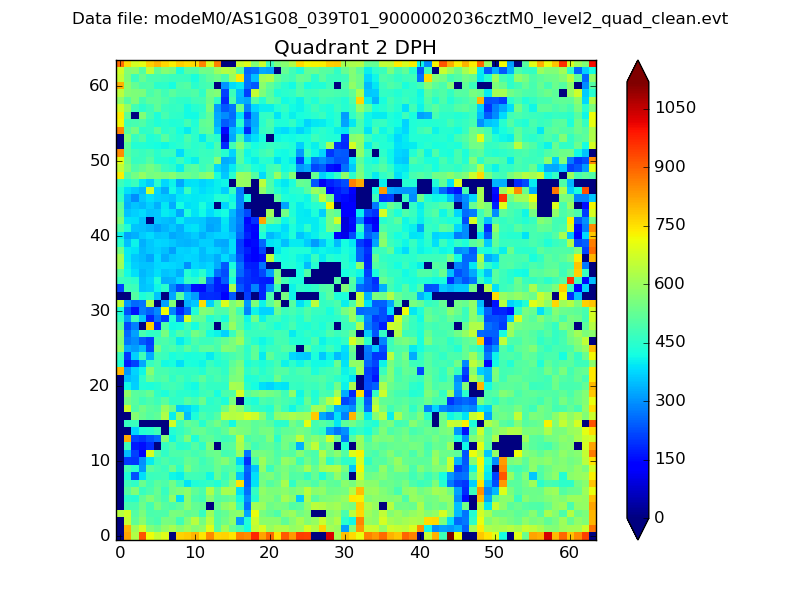 |
Quadrant C |
| Plot type | Count rate plots | Images |
|---|---|---|
| Comparison with Poisson distribution Blue bars denote a histogram of data divided into 1 sec bins. Red curve is a Poisson curve with rate = median count rate of data. |
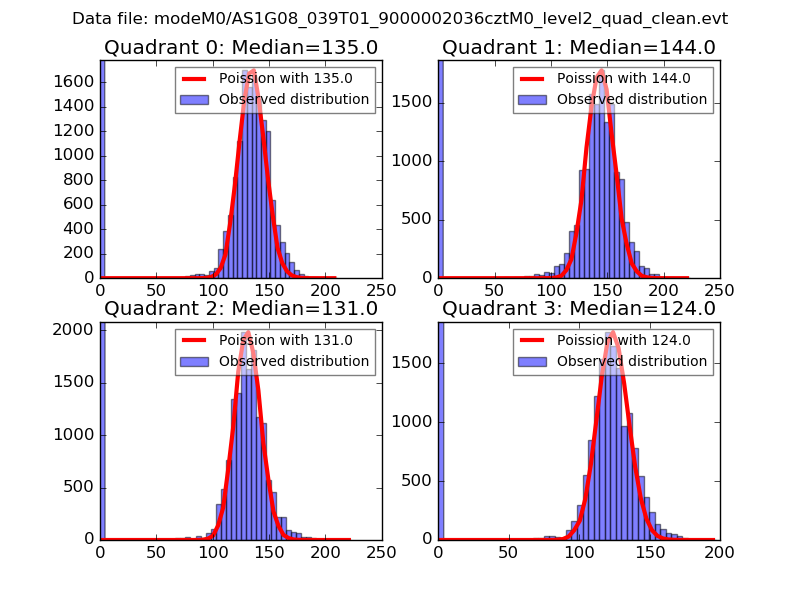 |
 |
| Quadrant-wise count rates Data is divided into 100 sec bins |
 |
|
| Module-wise count rates for Quadrant A Data is divided into 100 sec bins |
 |
 |
| Module-wise count rates for Quadrant B Data is divided into 100 sec bins |
 |
 |
| Module-wise count rates for Quadrant C Data is divided into 100 sec bins |
 |
 |
| Module-wise count rates for Quadrant D Data is divided into 100 sec bins |
 |
 |
| Parameter | Plot |
|---|---|
| CZT HV Monitor | 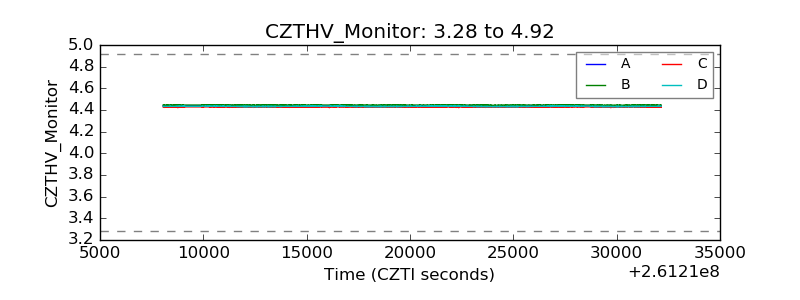 |
| D_VDD | 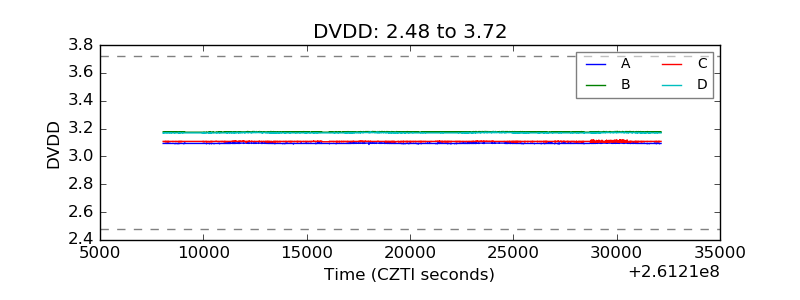 |
| Temperature 1 |  |
| Veto HV Monitor |  |
| Veto LLD |  |
| Alpha Counter |  |
| _CPM_Rate |  |
| CZT Counter |  |
| +2.5 Volts monitor |  |
| +5 Volts monitor |  |
| _ROLL_ROT |  |
| _Roll_DEC |  |
| _Roll_RA |  |
| Veto Counter | 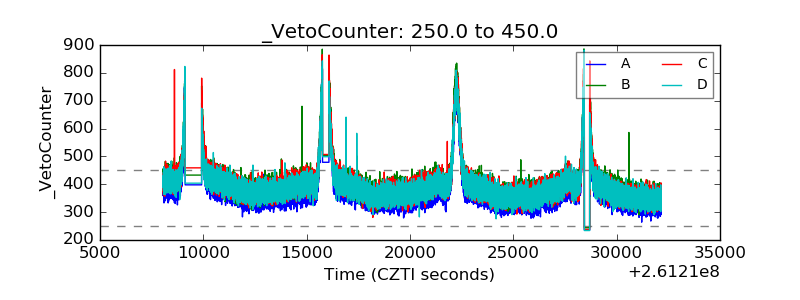 |