| Param | Original file | Final file |
|---|---|---|
| Filename | modeM0/AS1T02_041T01_9000002032cztM0_level2_bc.evt | modeM0/AS1T02_041T01_9000002032cztM0_level2_quad_clean.evt |
| Size (bytes) | 2,348,562,240 | 1,355,440,320 |
| Size | 2.2 GB | 1.3 GB |
| Events in quadrant A | 14,242,995 | 8,979,835 |
| Events in quadrant B | 16,500,091 | 9,222,622 |
| Events in quadrant C | 16,876,607 | 9,206,642 |
| Events in quadrant D | 18,724,703 | 8,841,537 |
| Mode M0 | |||
|---|---|---|---|
| Quadrant | BADHDUFLAG | Total packets | Discarded packets |
| A | 0 | 143521 | 0 |
| B | 0 | 149975 | 0 |
| C | 0 | 149808 | 0 |
| D | 0 | 155493 | 0 |
| Mode SS | |||
|---|---|---|---|
| Quadrant | BADHDUFLAG | Total packets | Discarded packets |
| A | 0 | 1428 | 0 |
| B | 0 | 1428 | 0 |
| C | 0 | 1428 | 0 |
| D | 0 | 1428 | 0 |
| Mode M9 | |||
|---|---|---|---|
| Quadrant | BADHDUFLAG | Total packets | Discarded packets |
| A | 0 | 109 | 0 |
| B | 0 | 109 | 0 |
| C | 0 | 109 | 0 |
| D | 0 | 109 | 0 |
| Quadrant | Total seconds | Saturated seconds | Saturation percentage |
|---|---|---|---|
| A | 70163 | 623 | 0.887932% |
| B | 70163 | 924 | 1.316933% |
| C | 70163 | 959 | 1.366817% |
| D | 70163 | 932 | 1.328335% |
Noise dominated data is calculated using 1-second bins in cleaned event files. If a bin has >2000 counts, and if more than 50% of those come from <1% of pixels, then it is considered to be noise-dominated and hence unusable.
| Quadrant | # 1 sec bins | Bins with >0 counts | Bins with >2000 counts | High rate bins dominated by noise | Noise dominated (total time) | Noise dominated (detector-on time) | Marked lightcurve |
|---|---|---|---|---|---|---|---|
| A | 80894 | 70166 | 14 | 14 | 0.02% | 0.02% |  |
| B | 80894 | 70165 | 43 | 43 | 0.05% | 0.06% | 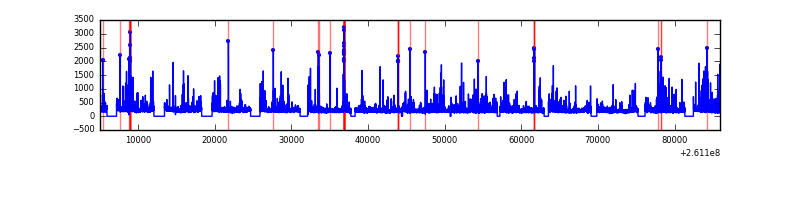 |
| C | 80894 | 70165 | 22 | 22 | 0.03% | 0.03% |  |
| D | 80894 | 70163 | 82 | 82 | 0.10% | 0.12% |  |
Top three noisy pixels from each quadrant. If the there are fewer than three noisy pixels in the level2.evt file, extra rows are filled as -1
| Pixel properties | Quadrant properties | ||||||
|---|---|---|---|---|---|---|---|
| Quadrant | DetID | PixID | Counts | Sigma | Mean | Median | Sigma |
| A | 15 | 222 | 245449 | 304.46 | 3592 | 3517 | 794.6 |
| A | 15 | 69 | 118829 | 145.11 | 3592 | 3517 | 794.6 |
| A | 1 | 162 | 87432 | 105.6 | 3592 | 3517 | 794.6 |
| B | 8 | 250 | 902580 | 1297.04 | 3658 | 3565 | 693.1 |
| B | 0 | 219 | 576287 | 826.29 | 3658 | 3565 | 693.1 |
| B | 3 | 64 | 182000 | 257.43 | 3658 | 3565 | 693.1 |
| C | 3 | 233 | 1328238 | 1659.02 | 3597 | 3576 | 798.5 |
| C | 4 | 254 | 1300145 | 1623.83 | 3597 | 3576 | 798.5 |
| C | 12 | 4 | 71860 | 85.52 | 3597 | 3576 | 798.5 |
| D | 5 | 222 | 1083871 | 1276.76 | 3600 | 3486 | 846.2 |
| D | 8 | 195 | 924829 | 1088.81 | 3600 | 3486 | 846.2 |
| D | 1 | 52 | 917137 | 1079.72 | 3600 | 3486 | 846.2 |
Histogram calculated using DETX and DETY for each event in the final _common_clean file
| Quadrant A |  |
 |
Quadrant B |
|---|---|---|---|
| Quadrant D | 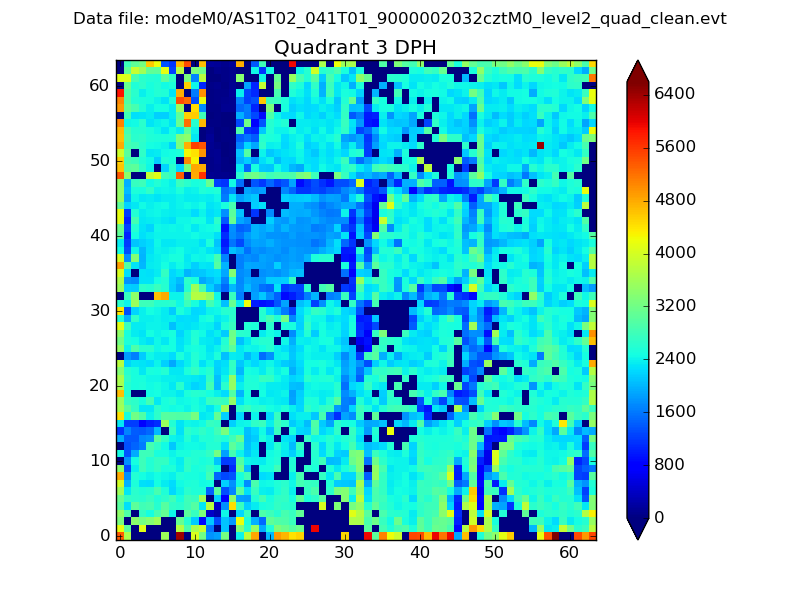 |
 |
Quadrant C |
| Plot type | Count rate plots | Images |
|---|---|---|
| Comparison with Poisson distribution Blue bars denote a histogram of data divided into 1 sec bins. Red curve is a Poisson curve with rate = median count rate of data. |
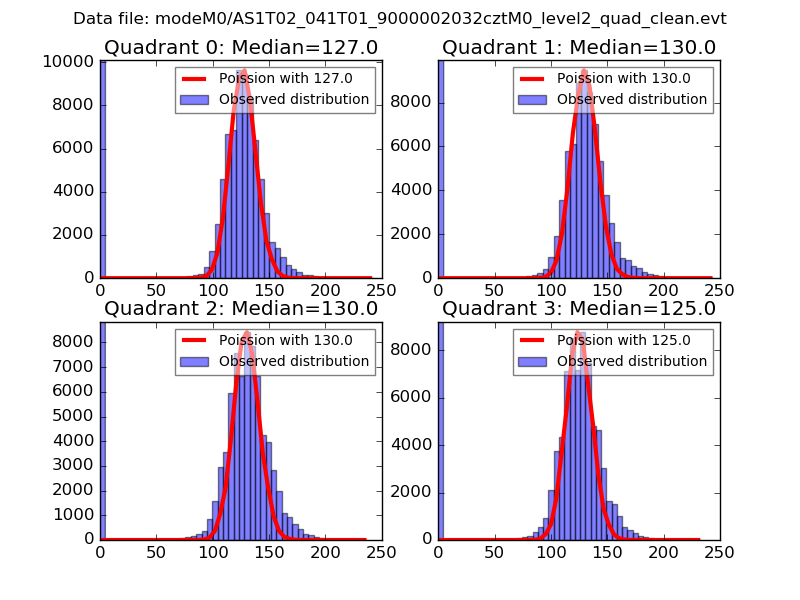 |
 |
| Quadrant-wise count rates Data is divided into 100 sec bins |
 |
|
| Module-wise count rates for Quadrant A Data is divided into 100 sec bins |
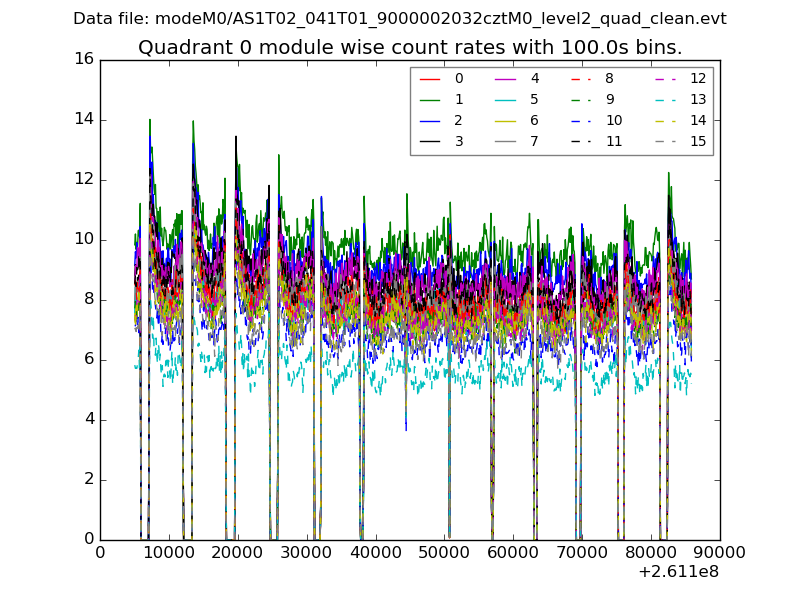 |
 |
| Module-wise count rates for Quadrant B Data is divided into 100 sec bins |
 |
 |
| Module-wise count rates for Quadrant C Data is divided into 100 sec bins |
 |
 |
| Module-wise count rates for Quadrant D Data is divided into 100 sec bins |
 |
 |
| Parameter | Plot |
|---|---|
| CZT HV Monitor |  |
| D_VDD | 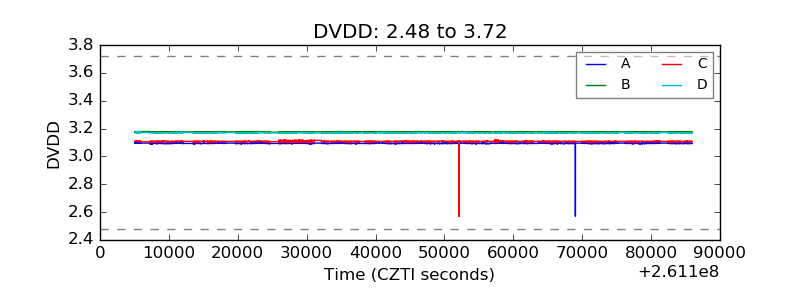 |
| Temperature 1 |  |
| Veto HV Monitor |  |
| Veto LLD |  |
| Alpha Counter |  |
| _CPM_Rate |  |
| CZT Counter |  |
| +2.5 Volts monitor |  |
| +5 Volts monitor |  |
| _ROLL_ROT | 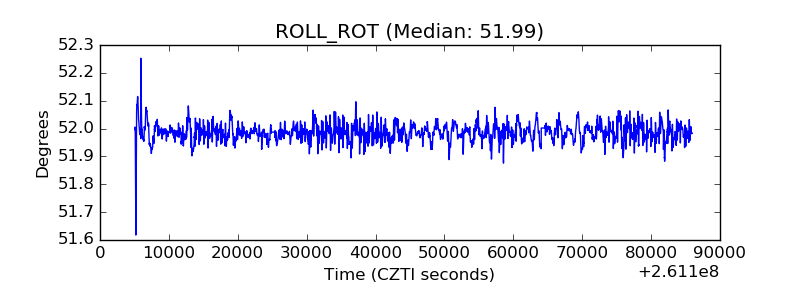 |
| _Roll_DEC |  |
| _Roll_RA |  |
| Veto Counter |  |