| Param | Original file | Final file |
|---|---|---|
| Filename | modeM0/AS1G08_036T01_9000002034cztM0_level2.evt | modeM0/AS1G08_036T01_9000002034cztM0_level2_quad_clean.evt |
| Size (bytes) | 1,800,705,600 | 316,990,080 |
| Size | 1.7 GB | 302.3 MB |
| Events in quadrant A | 12,030,808 | 2,017,456 |
| Events in quadrant B | 13,763,033 | 2,097,516 |
| Events in quadrant C | 12,301,266 | 1,962,446 |
| Events in quadrant D | 14,798,862 | 1,850,897 |
| Mode SS | |||
|---|---|---|---|
| Quadrant | BADHDUFLAG | Total packets | Discarded packets |
| A | 0 | 494 | 0 |
| B | 0 | 494 | 0 |
| C | 0 | 494 | 0 |
| D | 0 | 494 | 0 |
| Mode M0 | |||
|---|---|---|---|
| Quadrant | BADHDUFLAG | Total packets | Discarded packets |
| A | 0 | 50562 | 0 |
| B | 0 | 56134 | 0 |
| C | 0 | 51060 | 0 |
| D | 0 | 58990 | 0 |
| Mode M9 | |||
|---|---|---|---|
| Quadrant | BADHDUFLAG | Total packets | Discarded packets |
| A | 0 | 64 | 0 |
| B | 0 | 64 | 0 |
| C | 0 | 64 | 0 |
| D | 0 | 64 | 0 |
| Quadrant | Total seconds | Saturated seconds | Saturation percentage |
|---|---|---|---|
| A | 24324 | 136 | 0.559119% |
| B | 24324 | 265 | 1.089459% |
| C | 24324 | 104 | 0.427561% |
| D | 24324 | 435 | 1.788357% |
Noise dominated data is calculated using 1-second bins in cleaned event files. If a bin has >2000 counts, and if more than 50% of those come from <1% of pixels, then it is considered to be noise-dominated and hence unusable.
| Quadrant | # 1 sec bins | Bins with >0 counts | Bins with >2000 counts | High rate bins dominated by noise | Noise dominated (total time) | Noise dominated (detector-on time) | Marked lightcurve |
|---|---|---|---|---|---|---|---|
| A | 30630 | 24330 | 0 | 0 | 0.00% | 0.00% |  |
| B | 30630 | 24330 | 18 | 18 | 0.06% | 0.07% |  |
| C | 30630 | 24330 | 2 | 2 | 0.01% | 0.01% |  |
| D | 30630 | 24330 | 271 | 271 | 0.88% | 1.11% |  |
Top three noisy pixels from each quadrant. If the there are fewer than three noisy pixels in the level2.evt file, extra rows are filled as -1
| Pixel properties | Quadrant properties | ||||||
|---|---|---|---|---|---|---|---|
| Quadrant | DetID | PixID | Counts | Sigma | Mean | Median | Sigma |
| A | 1 | 162 | 28778 | 41.33 | 3119 | 3058 | 622.3 |
| A | 0 | 226 | 27718 | 39.63 | 3119 | 3058 | 622.3 |
| A | 12 | 194 | 23882 | 33.47 | 3119 | 3058 | 622.3 |
| B | 10 | 244 | 836349 | 1449.16 | 3122 | 3054 | 575.0 |
| B | 8 | 250 | 274683 | 472.38 | 3122 | 3054 | 575.0 |
| B | 0 | 219 | 158892 | 271.01 | 3122 | 3054 | 575.0 |
| C | 3 | 233 | 411831 | 589.64 | 3040 | 3061 | 693.3 |
| C | 4 | 254 | 30272 | 39.25 | 3040 | 3061 | 693.3 |
| C | 13 | 61 | 21806 | 27.04 | 3040 | 3061 | 693.3 |
| D | 5 | 222 | 2183506 | 2781.11 | 2989 | 2937 | 784.1 |
| D | 8 | 195 | 680791 | 864.54 | 2989 | 2937 | 784.1 |
| D | 10 | 157 | 243057 | 306.25 | 2989 | 2937 | 784.1 |
Histogram calculated using DETX and DETY for each event in the final _common_clean file
| Quadrant A |  |
 |
Quadrant B |
|---|---|---|---|
| Quadrant D | 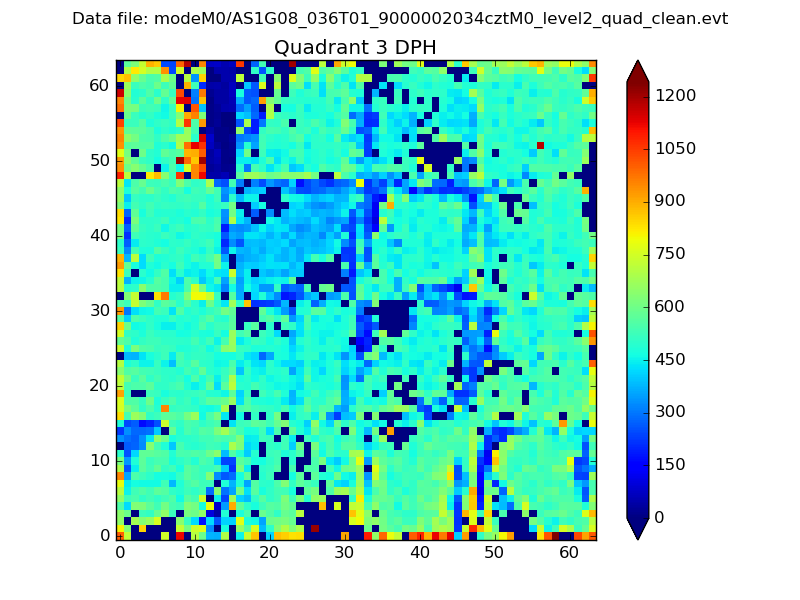 |
 |
Quadrant C |
| Plot type | Count rate plots | Images |
|---|---|---|
| Comparison with Poisson distribution Blue bars denote a histogram of data divided into 1 sec bins. Red curve is a Poisson curve with rate = median count rate of data. |
 |
 |
| Quadrant-wise count rates Data is divided into 100 sec bins |
 |
|
| Module-wise count rates for Quadrant A Data is divided into 100 sec bins |
 |
 |
| Module-wise count rates for Quadrant B Data is divided into 100 sec bins |
 |
 |
| Module-wise count rates for Quadrant C Data is divided into 100 sec bins |
 |
 |
| Module-wise count rates for Quadrant D Data is divided into 100 sec bins |
 |
 |
| Parameter | Plot |
|---|---|
| CZT HV Monitor |  |
| D_VDD | 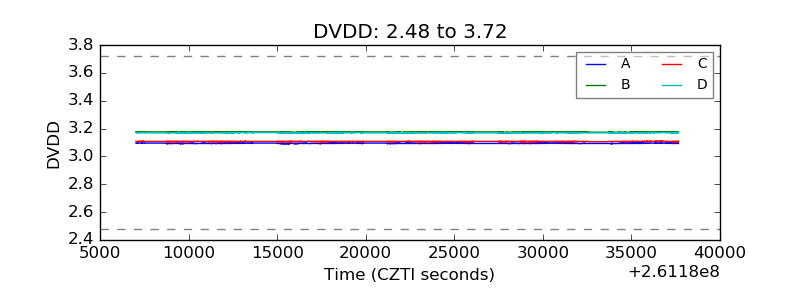 |
| Temperature 1 | 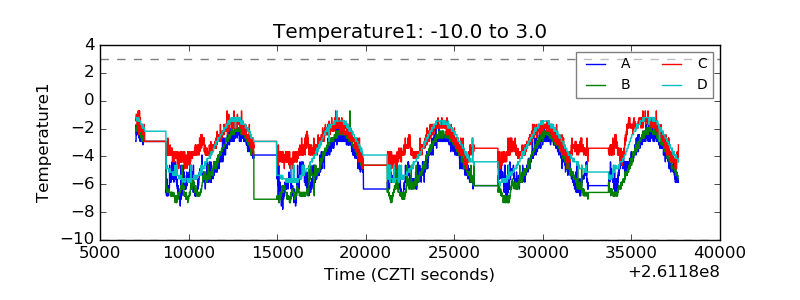 |
| Veto HV Monitor |  |
| Veto LLD |  |
| Alpha Counter |  |
| _CPM_Rate | 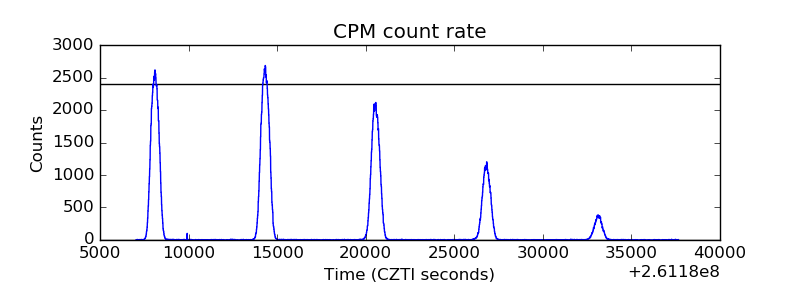 |
| CZT Counter |  |
| +2.5 Volts monitor | 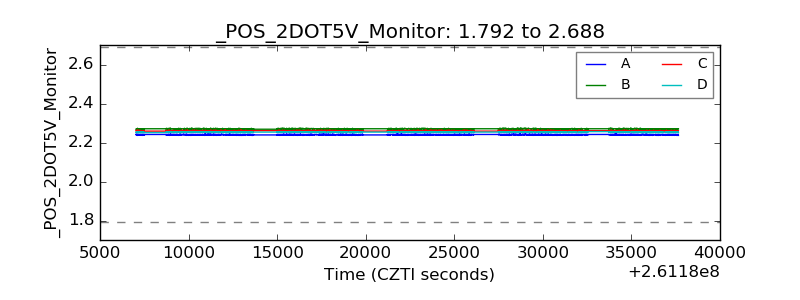 |
| +5 Volts monitor |  |
| _ROLL_ROT |  |
| _Roll_DEC |  |
| _Roll_RA |  |
| Veto Counter |  |