| Param | Original file | Final file |
|---|---|---|
| Filename | modeM0/AS1G08_070T01_9000002028cztM0_level2_bc.evt | modeM0/AS1G08_070T01_9000002028cztM0_level2_quad_clean.evt |
| Size (bytes) | 6,745,083,840 | 2,269,356,480 |
| Size | 6.3 GB | 2.1 GB |
| Events in quadrant A | 35,991,976 | 14,605,063 |
| Events in quadrant B | 45,348,616 | 15,531,099 |
| Events in quadrant C | 40,039,276 | 13,992,641 |
| Events in quadrant D | 71,378,555 | 13,012,277 |
| Mode M9 | |||
|---|---|---|---|
| Quadrant | BADHDUFLAG | Total packets | Discarded packets |
| A | 0 | 250 | 0 |
| B | 0 | 250 | 0 |
| C | 0 | 250 | 0 |
| D | 0 | 250 | 0 |
| Mode SS | |||
|---|---|---|---|
| Quadrant | BADHDUFLAG | Total packets | Discarded packets |
| A | 0 | 3442 | 0 |
| B | 0 | 3442 | 0 |
| C | 0 | 3442 | 0 |
| D | 0 | 3442 | 0 |
| Mode M0 | |||
|---|---|---|---|
| Quadrant | BADHDUFLAG | Total packets | Discarded packets |
| A | 0 | 353077 | 0 |
| B | 0 | 384396 | 0 |
| C | 0 | 357583 | 0 |
| D | 0 | 486259 | 0 |
| Quadrant | Total seconds | Saturated seconds | Saturation percentage |
|---|---|---|---|
| A | 169294 | 2594 | 1.532246% |
| B | 169294 | 4510 | 2.664005% |
| C | 169294 | 1842 | 1.088048% |
| D | 169294 | 9490 | 5.605633% |
Noise dominated data is calculated using 1-second bins in cleaned event files. If a bin has >2000 counts, and if more than 50% of those come from <1% of pixels, then it is considered to be noise-dominated and hence unusable.
| Quadrant | # 1 sec bins | Bins with >0 counts | Bins with >2000 counts | High rate bins dominated by noise | Noise dominated (total time) | Noise dominated (detector-on time) | Marked lightcurve |
|---|---|---|---|---|---|---|---|
| A | 194225 | 169304 | 7 | 7 | 0.00% | 0.00% |  |
| B | 194225 | 169303 | 347 | 347 | 0.18% | 0.20% |  |
| C | 194225 | 169304 | 1 | 1 | 0.00% | 0.00% |  |
| D | 194225 | 169298 | 736 | 736 | 0.38% | 0.43% | 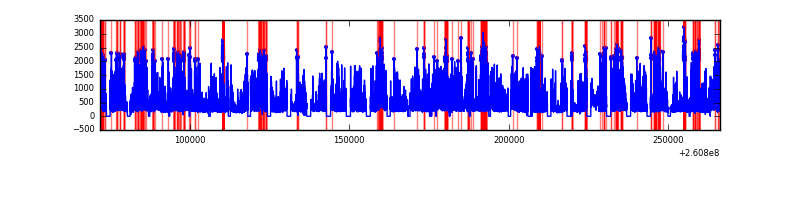 |
Top three noisy pixels from each quadrant. If the there are fewer than three noisy pixels in the level2.evt file, extra rows are filled as -1
| Pixel properties | Quadrant properties | ||||||
|---|---|---|---|---|---|---|---|
| Quadrant | DetID | PixID | Counts | Sigma | Mean | Median | Sigma |
| A | 15 | 69 | 341129 | 167.12 | 9168 | 8966 | 1987.6 |
| A | 1 | 162 | 254488 | 123.53 | 9168 | 8966 | 1987.6 |
| A | 9 | 143 | 71582 | 31.5 | 9168 | 8966 | 1987.6 |
| B | 0 | 219 | 3333612 | 1786.96 | 9461 | 9181 | 1860.4 |
| B | 3 | 64 | 1907832 | 1020.57 | 9461 | 9181 | 1860.4 |
| B | 8 | 250 | 1639067 | 876.1 | 9461 | 9181 | 1860.4 |
| C | 3 | 233 | 5216156 | 2686.52 | 8845 | 8747 | 1938.3 |
| C | 14 | 234 | 107069 | 50.72 | 8845 | 8747 | 1938.3 |
| C | 14 | 220 | 63664 | 28.33 | 8845 | 8747 | 1938.3 |
| D | 13 | 122 | 13638779 | 6758.27 | 8666 | 8365 | 2016.8 |
| D | 5 | 222 | 8466211 | 4193.59 | 8666 | 8365 | 2016.8 |
| D | 1 | 52 | 5979932 | 2960.84 | 8666 | 8365 | 2016.8 |
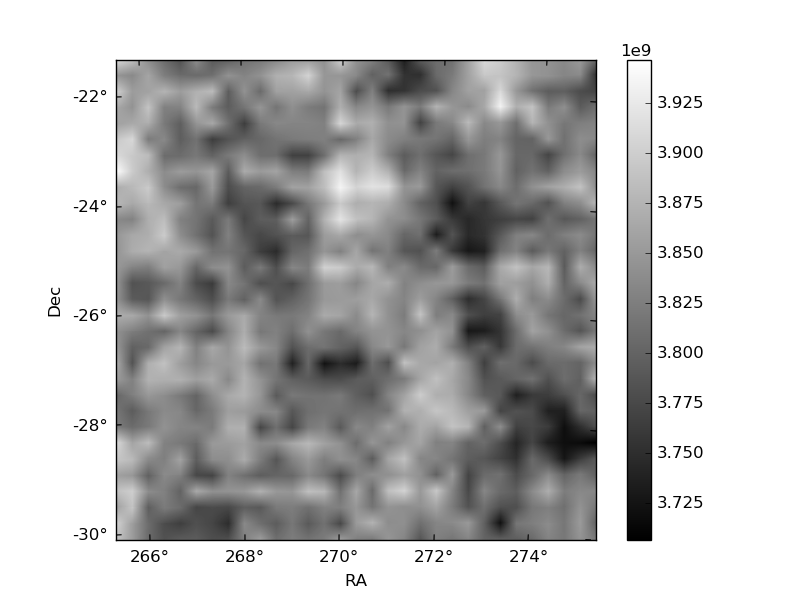
Histogram calculated using DETX and DETY for each event in the final _common_clean file
| Quadrant A |  |
 |
Quadrant B |
|---|---|---|---|
| Quadrant D |  |
 |
Quadrant C |
| Plot type | Count rate plots | Images |
|---|---|---|
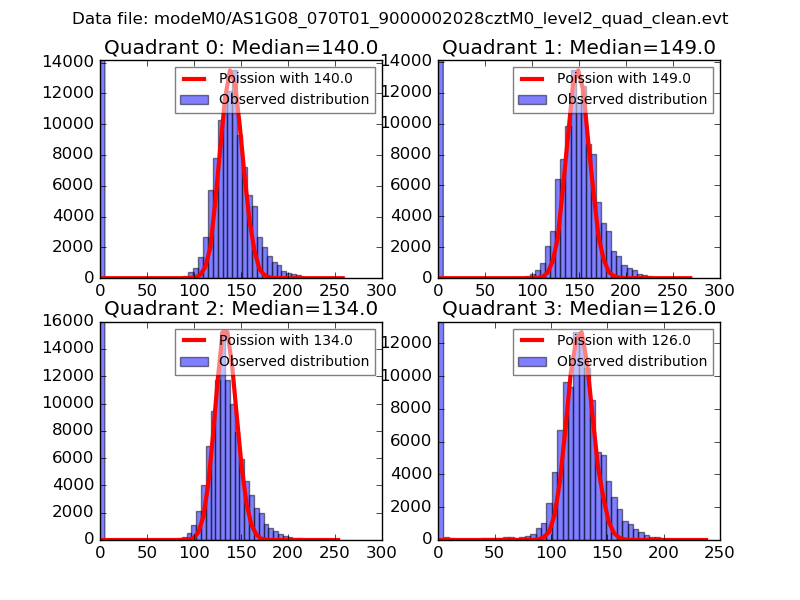
| Comparison with Poisson distribution Blue bars denote a histogram of data divided into 1 sec bins. Red curve is a Poisson curve with rate = median count rate of data. |
 |
 |
| Quadrant-wise count rates Data is divided into 100 sec bins |
 |
|
| Module-wise count rates for Quadrant A Data is divided into 100 sec bins |
 |
 |
| Module-wise count rates for Quadrant B Data is divided into 100 sec bins |
 |
 |
| Module-wise count rates for Quadrant C Data is divided into 100 sec bins |
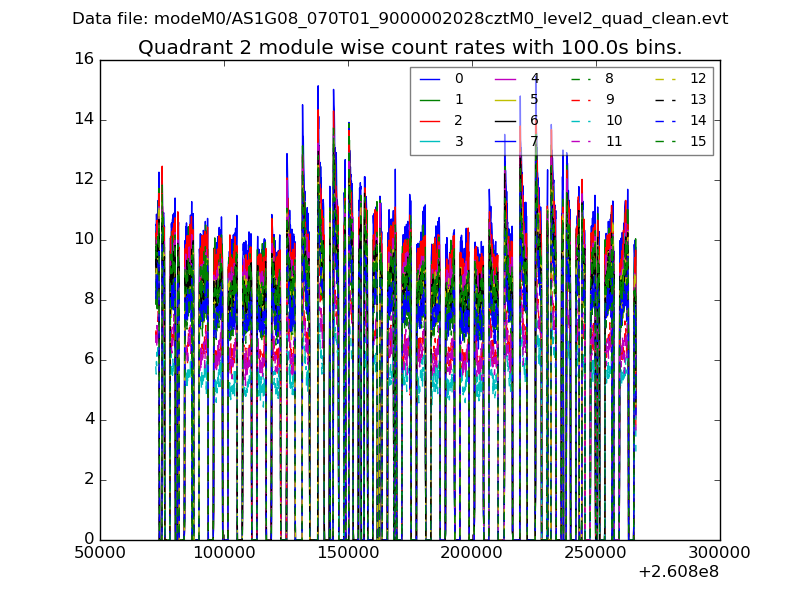 |
 |
| Module-wise count rates for Quadrant D Data is divided into 100 sec bins |
 |
 |
| Parameter | Plot |
|---|---|
| CZT HV Monitor |  |
| D_VDD |  |
| Temperature 1 |  |
| Veto HV Monitor |  |
| Veto LLD |  |
| Alpha Counter | 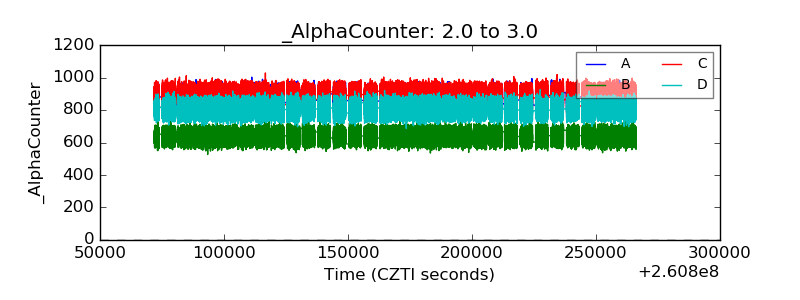 |
| _CPM_Rate |  |
| CZT Counter |  |
| +2.5 Volts monitor |  |
| +5 Volts monitor |  |
| _ROLL_ROT |  |
| _Roll_DEC |  |
| _Roll_RA | 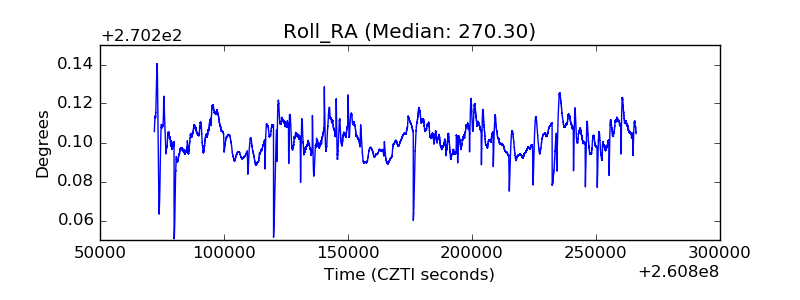 |
| Veto Counter |  |