| Param | Original file | Final file |
|---|---|---|
| Filename | modeM0/AS1G08_075T01_9000002024cztM0_level2_bc.evt | modeM0/AS1G08_075T01_9000002024cztM0_level2_quad_clean.evt |
| Size (bytes) | 1,411,274,880 | 539,196,480 |
| Size | 1.3 GB | 514.2 MB |
| Events in quadrant A | 9,060,610 | 3,353,716 |
| Events in quadrant B | 9,374,552 | 3,348,305 |
| Events in quadrant C | 8,976,490 | 3,585,260 |
| Events in quadrant D | 12,707,160 | 3,406,928 |
| Mode M9 | |||
|---|---|---|---|
| Quadrant | BADHDUFLAG | Total packets | Discarded packets |
| A | 0 | 39 | 0 |
| B | 0 | 39 | 0 |
| C | 0 | 39 | 0 |
| D | 0 | 39 | 0 |
| Mode M0 | |||
|---|---|---|---|
| Quadrant | BADHDUFLAG | Total packets | Discarded packets |
| A | 0 | 83835 | 0 |
| B | 0 | 86806 | 0 |
| C | 0 | 79992 | 0 |
| D | 0 | 93676 | 0 |
| Mode SS | |||
|---|---|---|---|
| Quadrant | BADHDUFLAG | Total packets | Discarded packets |
| A | 0 | 784 | 0 |
| B | 0 | 784 | 0 |
| C | 0 | 784 | 0 |
| D | 0 | 784 | 0 |
| Quadrant | Total seconds | Saturated seconds | Saturation percentage |
|---|---|---|---|
| A | 38413 | 892 | 2.322131% |
| B | 38413 | 1199 | 3.121339% |
| C | 38413 | 542 | 1.410981% |
| D | 38413 | 1043 | 2.715227% |
Noise dominated data is calculated using 1-second bins in cleaned event files. If a bin has >2000 counts, and if more than 50% of those come from <1% of pixels, then it is considered to be noise-dominated and hence unusable.
| Quadrant | # 1 sec bins | Bins with >0 counts | Bins with >2000 counts | High rate bins dominated by noise | Noise dominated (total time) | Noise dominated (detector-on time) | Marked lightcurve |
|---|---|---|---|---|---|---|---|
| A | 42349 | 38417 | 46 | 46 | 0.11% | 0.12% | 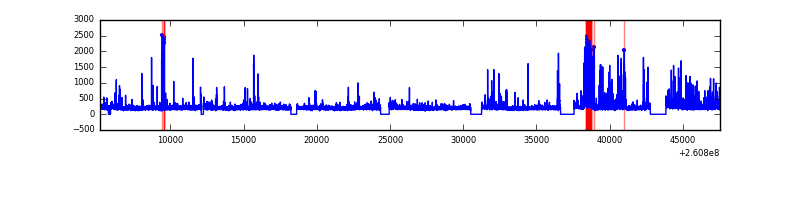 |
| B | 42349 | 38415 | 14 | 14 | 0.03% | 0.04% |  |
| C | 42349 | 38416 | 0 | 0 | 0.00% | 0.00% |  |
| D | 42349 | 38415 | 21 | 21 | 0.05% | 0.05% |  |
Top three noisy pixels from each quadrant. If the there are fewer than three noisy pixels in the level2.evt file, extra rows are filled as -1
| Pixel properties | Quadrant properties | ||||||
|---|---|---|---|---|---|---|---|
| Quadrant | DetID | PixID | Counts | Sigma | Mean | Median | Sigma |
| A | 9 | 143 | 1187367 | 2727.22 | 1953 | 1909 | 434.7 |
| A | 12 | 96 | 169415 | 385.36 | 1953 | 1909 | 434.7 |
| A | 15 | 69 | 65261 | 145.75 | 1953 | 1909 | 434.7 |
| B | 0 | 219 | 981950 | 2623.38 | 1944 | 1893 | 373.6 |
| B | 3 | 64 | 291865 | 776.18 | 1944 | 1893 | 373.6 |
| B | 0 | 189 | 182348 | 483.03 | 1944 | 1893 | 373.6 |
| C | 3 | 233 | 1133829 | 2402.29 | 1993 | 1954 | 471.2 |
| C | 14 | 234 | 24659 | 48.19 | 1993 | 1954 | 471.2 |
| C | 8 | 128 | 12107 | 21.55 | 1993 | 1954 | 471.2 |
| D | 5 | 222 | 2183531 | 4494.12 | 1988 | 1898 | 485.4 |
| D | 8 | 195 | 1499054 | 3084.11 | 1988 | 1898 | 485.4 |
| D | 1 | 52 | 346497 | 709.87 | 1988 | 1898 | 485.4 |
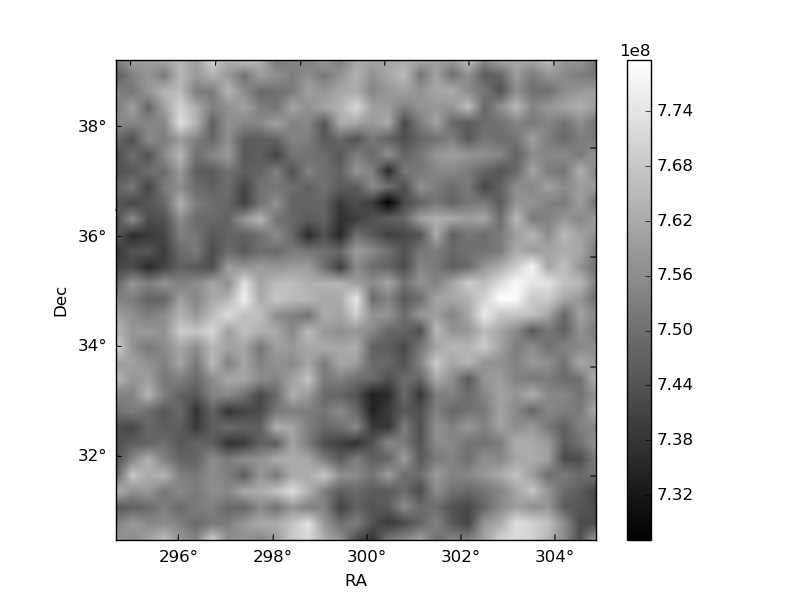
Histogram calculated using DETX and DETY for each event in the final _common_clean file
| Quadrant A |  |
 |
Quadrant B |
|---|---|---|---|
| Quadrant D |  |
 |
Quadrant C |
| Plot type | Count rate plots | Images |
|---|---|---|
| Comparison with Poisson distribution Blue bars denote a histogram of data divided into 1 sec bins. Red curve is a Poisson curve with rate = median count rate of data. |
 |
 |
| Quadrant-wise count rates Data is divided into 100 sec bins |
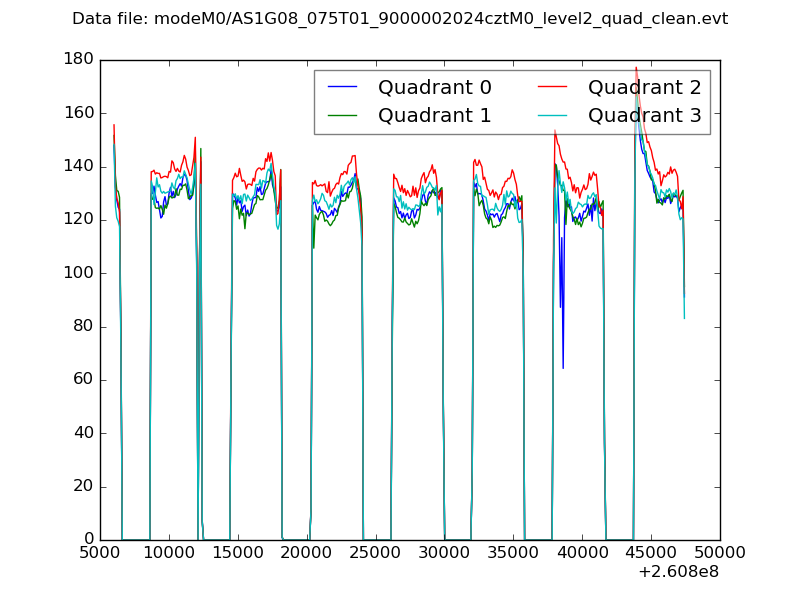 |
|
| Module-wise count rates for Quadrant A Data is divided into 100 sec bins |
 |
 |
| Module-wise count rates for Quadrant B Data is divided into 100 sec bins |
 |
 |
| Module-wise count rates for Quadrant C Data is divided into 100 sec bins |
 |
 |
| Module-wise count rates for Quadrant D Data is divided into 100 sec bins |
 |
 |
| Parameter | Plot |
|---|---|
| CZT HV Monitor |  |
| D_VDD | 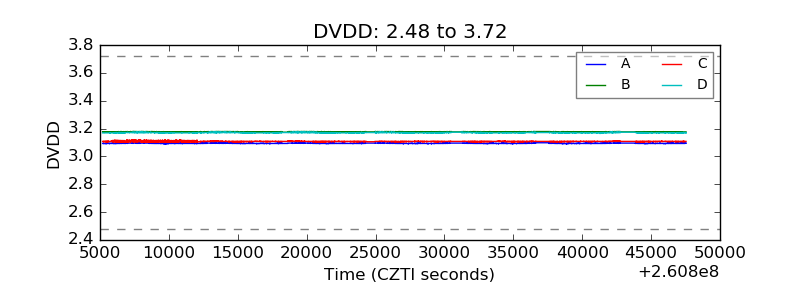 |
| Temperature 1 |  |
| Veto HV Monitor |  |
| Veto LLD | 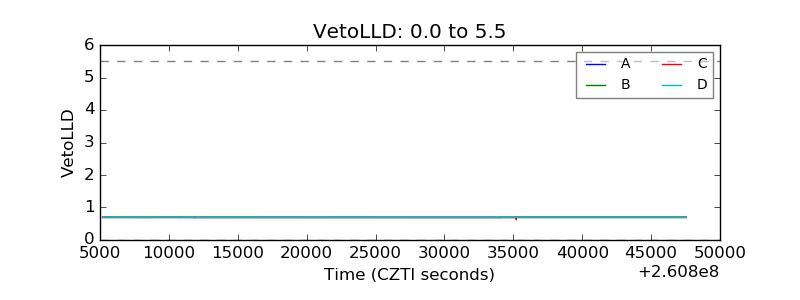 |
| Alpha Counter |  |
| _CPM_Rate |  |
| CZT Counter |  |
| +2.5 Volts monitor |  |
| +5 Volts monitor |  |
| _ROLL_ROT |  |
| _Roll_DEC |  |
| _Roll_RA | 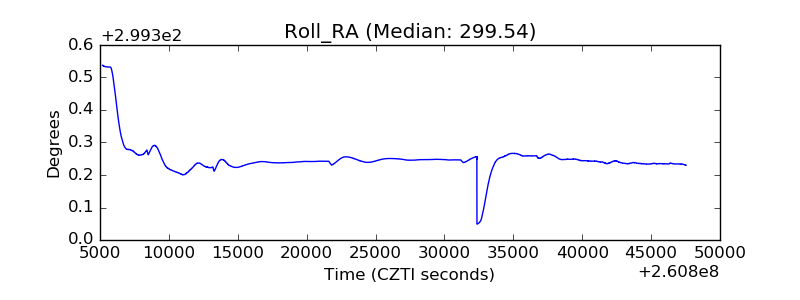 |
| Veto Counter | 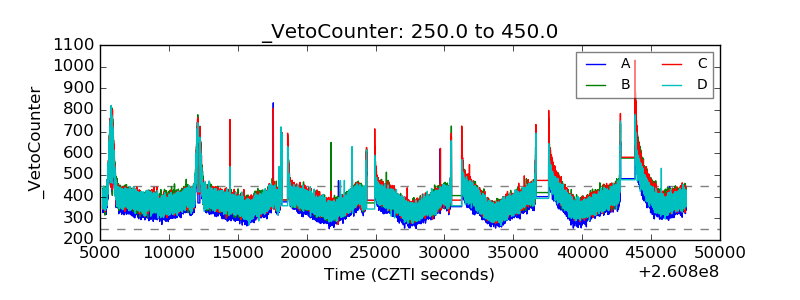 |