| Param | Original file | Final file |
|---|---|---|
| Filename | modeM0/AS1G08_044T01_9000002014cztM0_level2_bc.evt | modeM0/AS1G08_044T01_9000002014cztM0_level2_quad_clean.evt |
| Size (bytes) | 708,183,360 | 241,318,080 |
| Size | 675.4 MB | 230.1 MB |
| Events in quadrant A | 4,073,502 | 1,546,137 |
| Events in quadrant B | 5,262,497 | 1,526,233 |
| Events in quadrant C | 4,352,275 | 1,489,357 |
| Events in quadrant D | 6,466,847 | 1,446,225 |
| Mode M9 | |||
|---|---|---|---|
| Quadrant | BADHDUFLAG | Total packets | Discarded packets |
| A | 0 | 46 | 0 |
| B | 0 | 46 | 0 |
| C | 0 | 46 | 0 |
| D | 0 | 46 | 0 |
| Mode SS | |||
|---|---|---|---|
| Quadrant | BADHDUFLAG | Total packets | Discarded packets |
| A | 0 | 386 | 0 |
| B | 0 | 386 | 0 |
| C | 0 | 386 | 0 |
| D | 0 | 386 | 0 |
| Mode M0 | |||
|---|---|---|---|
| Quadrant | BADHDUFLAG | Total packets | Discarded packets |
| A | 0 | 39594 | 0 |
| B | 0 | 44566 | 0 |
| C | 0 | 39497 | 0 |
| D | 0 | 47212 | 0 |
| Quadrant | Total seconds | Saturated seconds | Saturation percentage |
|---|---|---|---|
| A | 18883 | 150 | 0.794365% |
| B | 18883 | 363 | 1.922364% |
| C | 18883 | 87 | 0.460732% |
| D | 18883 | 363 | 1.922364% |
Noise dominated data is calculated using 1-second bins in cleaned event files. If a bin has >2000 counts, and if more than 50% of those come from <1% of pixels, then it is considered to be noise-dominated and hence unusable.
| Quadrant | # 1 sec bins | Bins with >0 counts | Bins with >2000 counts | High rate bins dominated by noise | Noise dominated (total time) | Noise dominated (detector-on time) | Marked lightcurve |
|---|---|---|---|---|---|---|---|
| A | 23559 | 18886 | 1 | 1 | 0.00% | 0.01% |  |
| B | 23559 | 18884 | 2 | 2 | 0.01% | 0.01% | 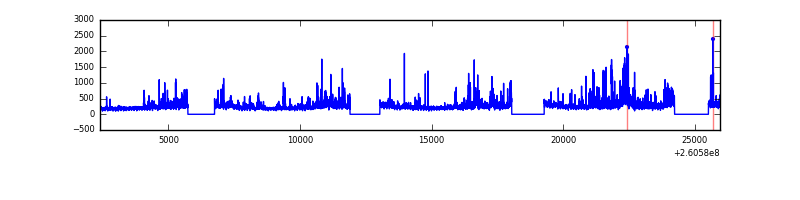 |
| C | 23559 | 18885 | 0 | 0 | 0.00% | 0.00% | 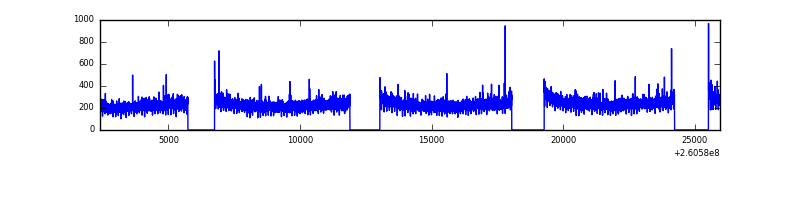 |
| D | 23559 | 18884 | 18 | 18 | 0.08% | 0.10% | 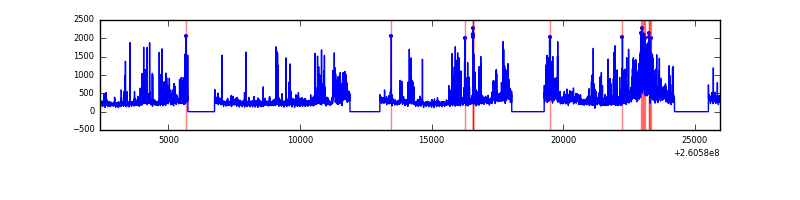 |
Top three noisy pixels from each quadrant. If the there are fewer than three noisy pixels in the level2.evt file, extra rows are filled as -1
| Pixel properties | Quadrant properties | ||||||
|---|---|---|---|---|---|---|---|
| Quadrant | DetID | PixID | Counts | Sigma | Mean | Median | Sigma |
| A | 3 | 0 | 54589 | 238.17 | 1030 | 1007 | 225.0 |
| A | 1 | 162 | 34516 | 148.94 | 1030 | 1007 | 225.0 |
| A | 15 | 69 | 23688 | 100.82 | 1030 | 1007 | 225.0 |
| B | 0 | 219 | 471030 | 2427.43 | 1021 | 995 | 193.6 |
| B | 0 | 85 | 331734 | 1708.06 | 1021 | 995 | 193.6 |
| B | 0 | 189 | 138372 | 709.47 | 1021 | 995 | 193.6 |
| C | 3 | 233 | 478333 | 2205.66 | 988 | 974 | 216.4 |
| C | 14 | 234 | 6026 | 23.34 | 988 | 974 | 216.4 |
| C | 13 | 61 | 5929 | 22.89 | 988 | 974 | 216.4 |
| D | 5 | 222 | 787617 | 3475.72 | 995 | 962 | 226.3 |
| D | 8 | 195 | 769630 | 3396.25 | 995 | 962 | 226.3 |
| D | 12 | 6 | 712835 | 3145.31 | 995 | 962 | 226.3 |
Histogram calculated using DETX and DETY for each event in the final _common_clean file
| Quadrant A |  |
 |
Quadrant B |
|---|---|---|---|
| Quadrant D |  |
 |
Quadrant C |
| Plot type | Count rate plots | Images |
|---|---|---|
| Comparison with Poisson distribution Blue bars denote a histogram of data divided into 1 sec bins. Red curve is a Poisson curve with rate = median count rate of data. |
 |
 |
| Quadrant-wise count rates Data is divided into 100 sec bins |
 |
|
| Module-wise count rates for Quadrant A Data is divided into 100 sec bins |
 |
 |
| Module-wise count rates for Quadrant B Data is divided into 100 sec bins |
 |
 |
| Module-wise count rates for Quadrant C Data is divided into 100 sec bins |
 |
 |
| Module-wise count rates for Quadrant D Data is divided into 100 sec bins |
 |
 |
| Parameter | Plot |
|---|---|
| CZT HV Monitor | 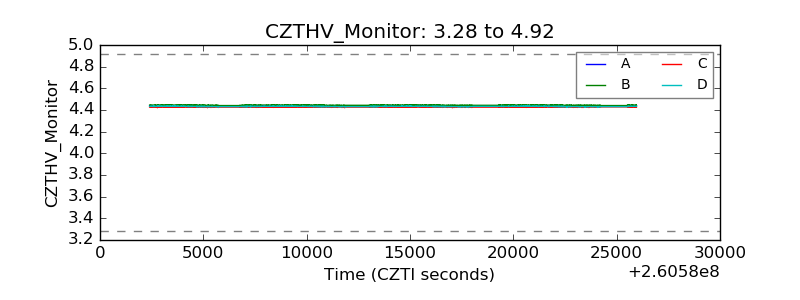 |
| D_VDD | 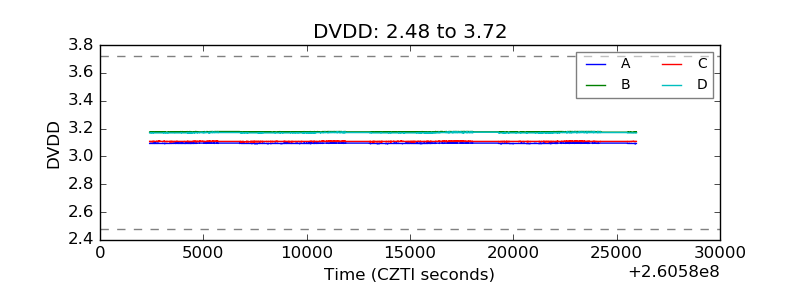 |
| Temperature 1 |  |
| Veto HV Monitor |  |
| Veto LLD | 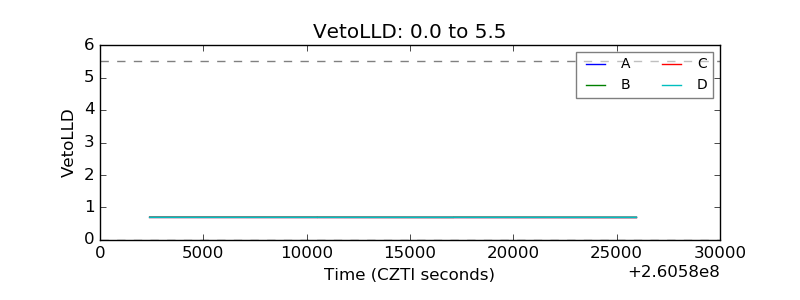 |
| Alpha Counter |  |
| _CPM_Rate |  |
| CZT Counter |  |
| +2.5 Volts monitor |  |
| +5 Volts monitor |  |
| _ROLL_ROT |  |
| _Roll_DEC |  |
| _Roll_RA | 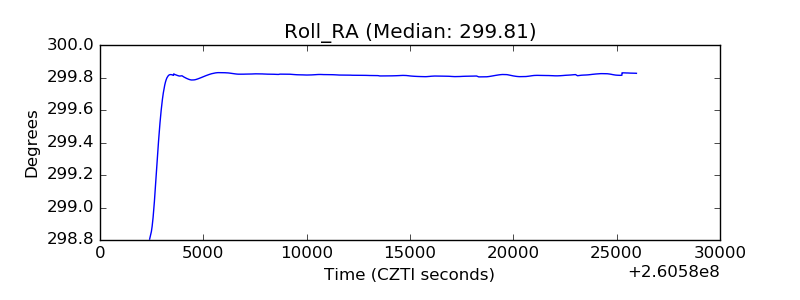 |
| Veto Counter | 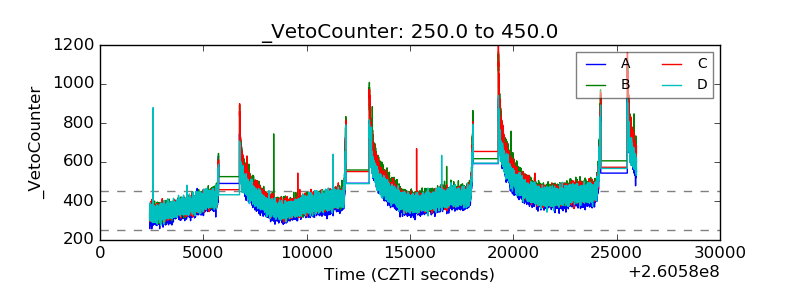 |