| Param | Original file | Final file |
|---|---|---|
| Filename | modeM0/AS1G08_038T01_9000002018cztM0_level2_bc.evt | modeM0/AS1G08_038T01_9000002018cztM0_level2_quad_clean.evt |
| Size (bytes) | 3,437,786,880 | 1,072,172,160 |
| Size | 3.2 GB | 1022.5 MB |
| Events in quadrant A | 16,646,087 | 6,480,377 |
| Events in quadrant B | 20,479,982 | 6,647,892 |
| Events in quadrant C | 19,249,095 | 7,202,799 |
| Events in quadrant D | 42,229,433 | 6,594,537 |
| Mode SS | |||
|---|---|---|---|
| Quadrant | BADHDUFLAG | Total packets | Discarded packets |
| A | 0 | 1654 | 0 |
| B | 0 | 1654 | 0 |
| C | 0 | 1650 | 0 |
| D | 0 | 1652 | 0 |
| Mode M0 | |||
|---|---|---|---|
| Quadrant | BADHDUFLAG | Total packets | Discarded packets |
| A | 0 | 167568 | 0 |
| B | 0 | 180919 | 0 |
| C | 0 | 168190 | 0 |
| D | 0 | 263096 | 0 |
| Mode M9 | |||
|---|---|---|---|
| Quadrant | BADHDUFLAG | Total packets | Discarded packets |
| A | 0 | 129 | 0 |
| B | 0 | 129 | 0 |
| C | 0 | 129 | 0 |
| D | 0 | 129 | 0 |
| Quadrant | Total seconds | Saturated seconds | Saturation percentage |
|---|---|---|---|
| A | 80953 | 891 | 1.100639% |
| B | 80956 | 1563 | 1.930678% |
| C | 80951 | 681 | 0.841250% |
| D | 80929 | 6329 | 7.820435% |
Noise dominated data is calculated using 1-second bins in cleaned event files. If a bin has >2000 counts, and if more than 50% of those come from <1% of pixels, then it is considered to be noise-dominated and hence unusable.
| Quadrant | # 1 sec bins | Bins with >0 counts | Bins with >2000 counts | High rate bins dominated by noise | Noise dominated (total time) | Noise dominated (detector-on time) | Marked lightcurve |
|---|---|---|---|---|---|---|---|
| A | 94034 | 81004 | 17 | 17 | 0.02% | 0.02% | 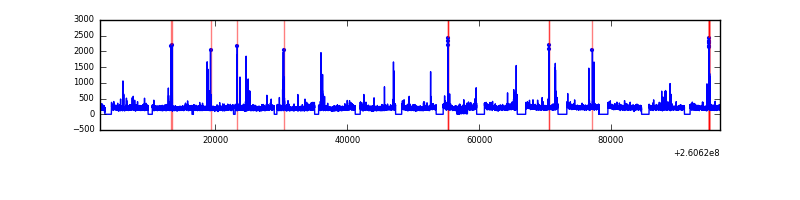 |
| B | 94034 | 80998 | 45 | 45 | 0.05% | 0.06% |  |
| C | 94034 | 80996 | 0 | 0 | 0.00% | 0.00% |  |
| D | 94034 | 80996 | 461 | 461 | 0.49% | 0.57% |  |
Top three noisy pixels from each quadrant. If the there are fewer than three noisy pixels in the level2.evt file, extra rows are filled as -1
| Pixel properties | Quadrant properties | ||||||
|---|---|---|---|---|---|---|---|
| Quadrant | DetID | PixID | Counts | Sigma | Mean | Median | Sigma |
| A | 15 | 69 | 350499 | 384.74 | 4179 | 4102 | 900.3 |
| A | 1 | 162 | 133676 | 143.92 | 4179 | 4102 | 900.3 |
| A | 9 | 143 | 51341 | 52.47 | 4179 | 4102 | 900.3 |
| B | 0 | 219 | 2051347 | 2551.34 | 4237 | 4115 | 802.4 |
| B | 3 | 64 | 755842 | 936.83 | 4237 | 4115 | 802.4 |
| B | 0 | 214 | 299067 | 367.58 | 4237 | 4115 | 802.4 |
| C | 3 | 233 | 2330050 | 2400.47 | 4308 | 4254 | 968.9 |
| C | 0 | 207 | 49941 | 47.15 | 4308 | 4254 | 968.9 |
| C | 14 | 234 | 39932 | 36.82 | 4308 | 4254 | 968.9 |
| D | 13 | 122 | 13173800 | 13534.58 | 4136 | 3981 | 973.0 |
| D | 5 | 222 | 8011342 | 8229.14 | 4136 | 3981 | 973.0 |
| D | 8 | 195 | 3222384 | 3307.54 | 4136 | 3981 | 973.0 |
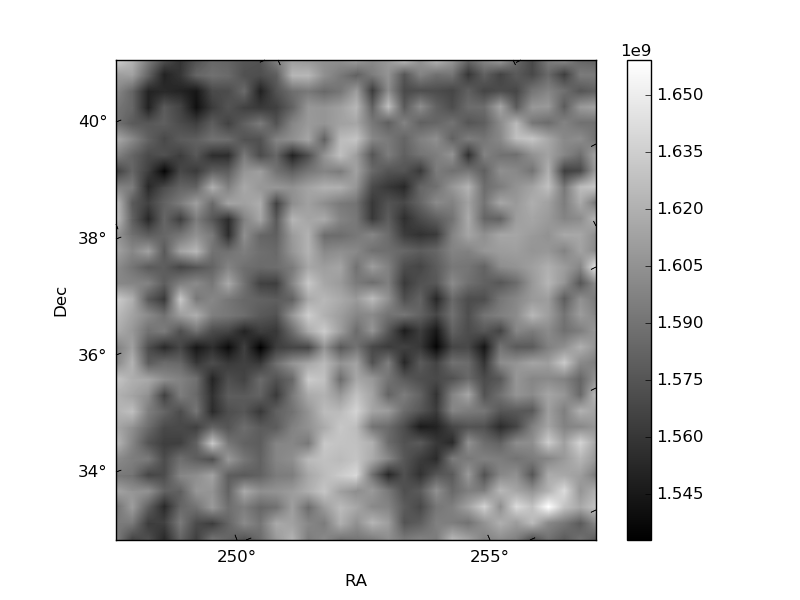
Histogram calculated using DETX and DETY for each event in the final _common_clean file
| Quadrant A |  |
 |
Quadrant B |
|---|---|---|---|
| Quadrant D |  |
 |
Quadrant C |
| Plot type | Count rate plots | Images |
|---|---|---|
| Comparison with Poisson distribution Blue bars denote a histogram of data divided into 1 sec bins. Red curve is a Poisson curve with rate = median count rate of data. |
 |
 |
| Quadrant-wise count rates Data is divided into 100 sec bins |
 |
|
| Module-wise count rates for Quadrant A Data is divided into 100 sec bins |
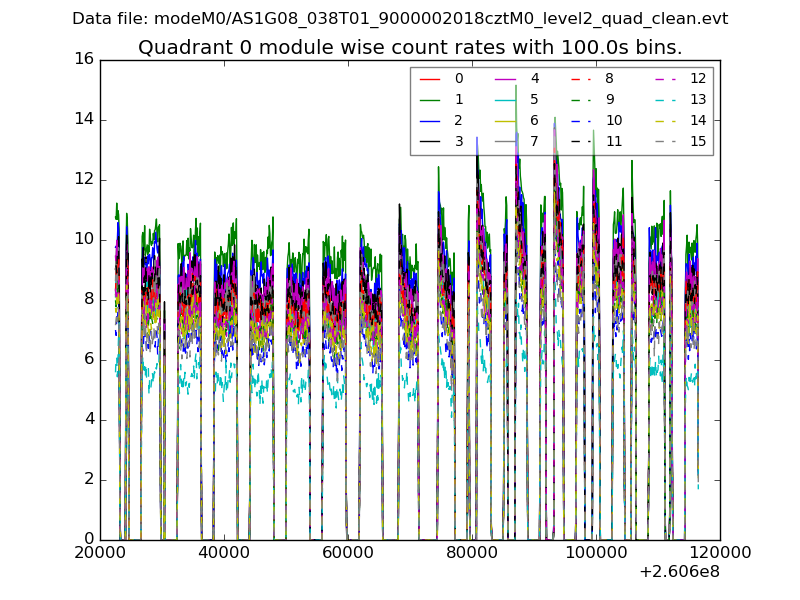 |
 |
| Module-wise count rates for Quadrant B Data is divided into 100 sec bins |
 |
 |
| Module-wise count rates for Quadrant C Data is divided into 100 sec bins |
 |
 |
| Module-wise count rates for Quadrant D Data is divided into 100 sec bins |
 |
 |
| Parameter | Plot |
|---|---|
| CZT HV Monitor |  |
| D_VDD |  |
| Temperature 1 |  |
| Veto HV Monitor | 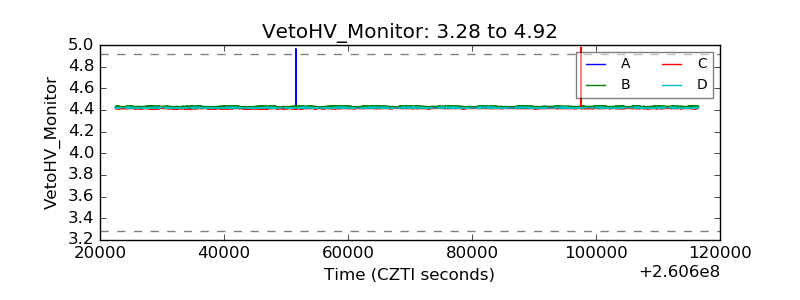 |
| Veto LLD | 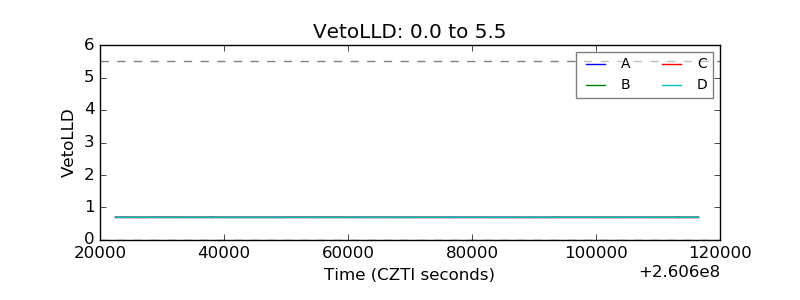 |
| Alpha Counter |  |
| _CPM_Rate |  |
| CZT Counter | 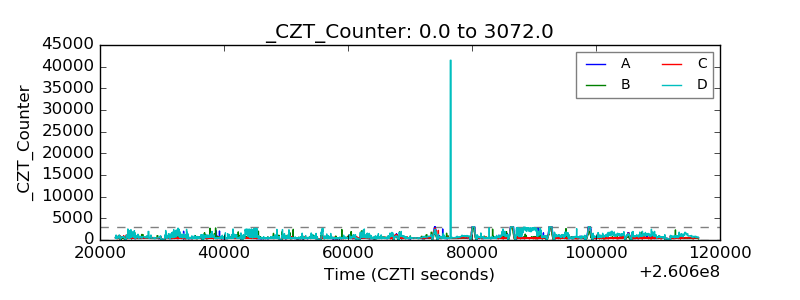 |
| +2.5 Volts monitor |  |
| +5 Volts monitor |  |
| _ROLL_ROT |  |
| _Roll_DEC |  |
| _Roll_RA | 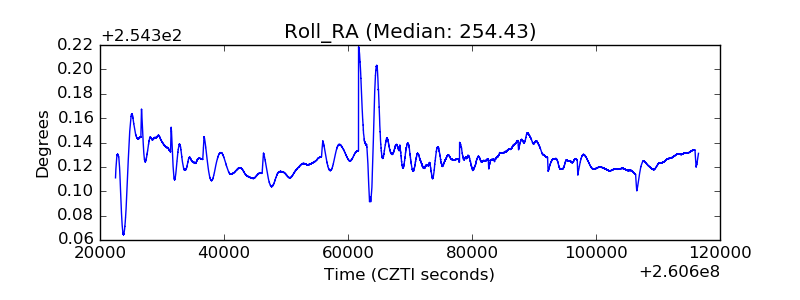 |
| Veto Counter | 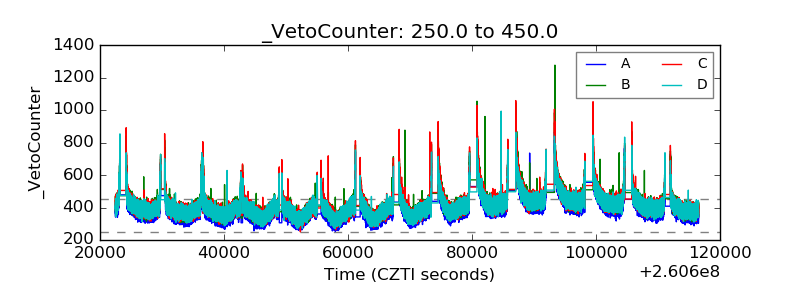 |