| Param | Original file | Final file |
|---|---|---|
| Filename | modeM0/AS1A04_212T03_9000002016cztM0_level2_bc.evt | modeM0/AS1A04_212T03_9000002016cztM0_level2_quad_clean.evt |
| Size (bytes) | 509,201,280 | 170,115,840 |
| Size | 485.6 MB | 162.2 MB |
| Events in quadrant A | 2,932,719 | 1,094,656 |
| Events in quadrant B | 3,853,048 | 1,104,320 |
| Events in quadrant C | 2,944,938 | 1,075,846 |
| Events in quadrant D | 4,848,304 | 1,029,100 |
| Mode M9 | |||
|---|---|---|---|
| Quadrant | BADHDUFLAG | Total packets | Discarded packets |
| A | 0 | 25 | 0 |
| B | 0 | 25 | 0 |
| C | 0 | 25 | 0 |
| D | 0 | 25 | 0 |
| Mode M0 | |||
|---|---|---|---|
| Quadrant | BADHDUFLAG | Total packets | Discarded packets |
| A | 0 | 26192 | 0 |
| B | 0 | 30306 | 0 |
| C | 0 | 25468 | 0 |
| D | 0 | 33116 | 0 |
| Mode SS | |||
|---|---|---|---|
| Quadrant | BADHDUFLAG | Total packets | Discarded packets |
| A | 0 | 252 | 0 |
| B | 0 | 252 | 0 |
| C | 0 | 252 | 0 |
| D | 0 | 252 | 0 |
| Quadrant | Total seconds | Saturated seconds | Saturation percentage |
|---|---|---|---|
| A | 12263 | 220 | 1.794015% |
| B | 12263 | 360 | 2.935660% |
| C | 12263 | 97 | 0.790997% |
| D | 12263 | 422 | 3.441246% |
Noise dominated data is calculated using 1-second bins in cleaned event files. If a bin has >2000 counts, and if more than 50% of those come from <1% of pixels, then it is considered to be noise-dominated and hence unusable.
| Quadrant | # 1 sec bins | Bins with >0 counts | Bins with >2000 counts | High rate bins dominated by noise | Noise dominated (total time) | Noise dominated (detector-on time) | Marked lightcurve |
|---|---|---|---|---|---|---|---|
| A | 14879 | 12264 | 13 | 13 | 0.09% | 0.11% |  |
| B | 14879 | 12264 | 2 | 2 | 0.01% | 0.02% |  |
| C | 14879 | 12264 | 0 | 0 | 0.00% | 0.00% |  |
| D | 14879 | 12264 | 11 | 11 | 0.07% | 0.09% |  |
Top three noisy pixels from each quadrant. If the there are fewer than three noisy pixels in the level2.evt file, extra rows are filled as -1
| Pixel properties | Quadrant properties | ||||||
|---|---|---|---|---|---|---|---|
| Quadrant | DetID | PixID | Counts | Sigma | Mean | Median | Sigma |
| A | 15 | 69 | 261775 | 1779.05 | 685 | 673 | 146.8 |
| A | 1 | 162 | 27760 | 184.56 | 685 | 673 | 146.8 |
| A | 12 | 194 | 4850 | 28.46 | 685 | 673 | 146.8 |
| B | 0 | 219 | 735613 | 5592.75 | 691 | 677 | 131.4 |
| B | 3 | 64 | 97248 | 734.89 | 691 | 677 | 131.4 |
| B | 0 | 85 | 94801 | 716.27 | 691 | 677 | 131.4 |
| C | 3 | 233 | 337951 | 2296.18 | 665 | 658 | 146.9 |
| C | 13 | 61 | 4056 | 23.13 | 665 | 658 | 146.9 |
| C | 8 | 222 | 3302 | 18.0 | 665 | 658 | 146.9 |
| D | 5 | 222 | 805396 | 5266.03 | 665 | 644 | 152.8 |
| D | 8 | 195 | 753224 | 4924.64 | 665 | 644 | 152.8 |
| D | 13 | 122 | 548972 | 3588.08 | 665 | 644 | 152.8 |
Histogram calculated using DETX and DETY for each event in the final _common_clean file
| Quadrant A |  |
 |
Quadrant B |
|---|---|---|---|
| Quadrant D |  |
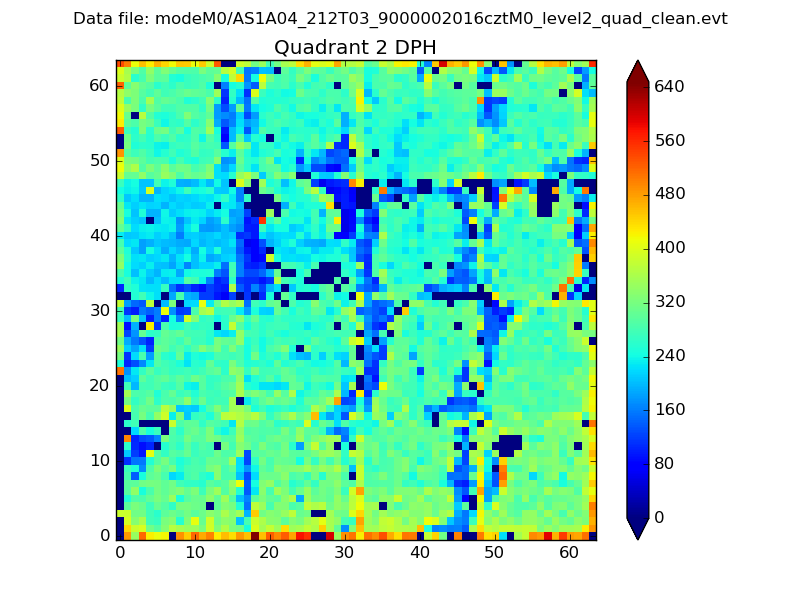 |
Quadrant C |
| Plot type | Count rate plots | Images |
|---|---|---|
| Comparison with Poisson distribution Blue bars denote a histogram of data divided into 1 sec bins. Red curve is a Poisson curve with rate = median count rate of data. |
 |
 |
| Quadrant-wise count rates Data is divided into 100 sec bins |
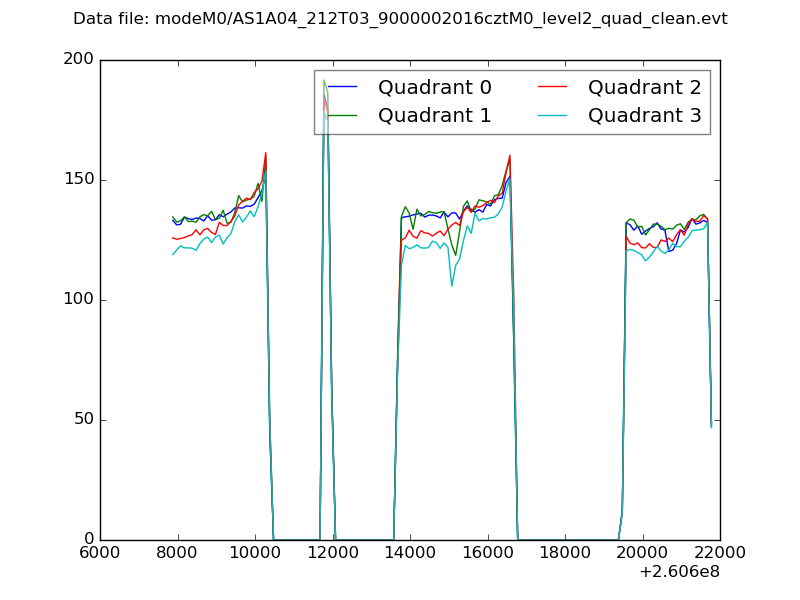 |
|
| Module-wise count rates for Quadrant A Data is divided into 100 sec bins |
 |
 |
| Module-wise count rates for Quadrant B Data is divided into 100 sec bins |
 |
 |
| Module-wise count rates for Quadrant C Data is divided into 100 sec bins |
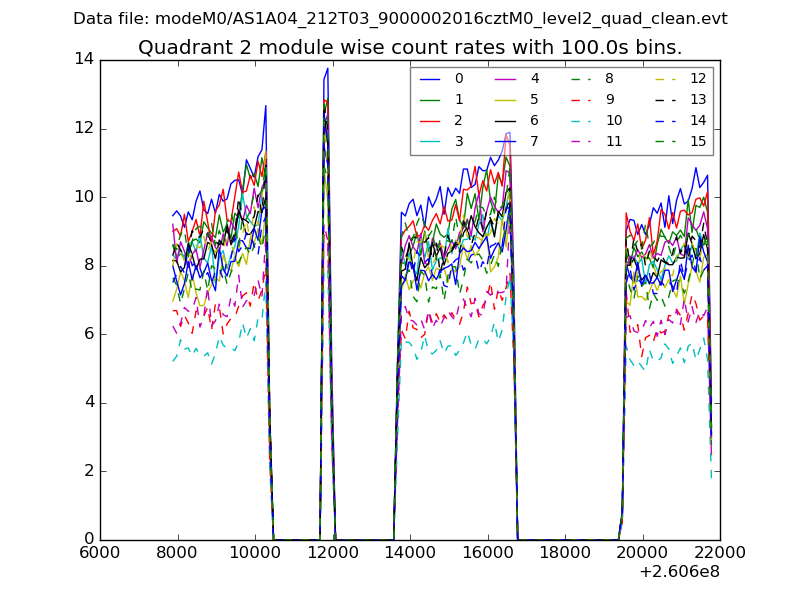 |
 |
| Module-wise count rates for Quadrant D Data is divided into 100 sec bins |
 |
 |
| Parameter | Plot |
|---|---|
| CZT HV Monitor |  |
| D_VDD |  |
| Temperature 1 |  |
| Veto HV Monitor | 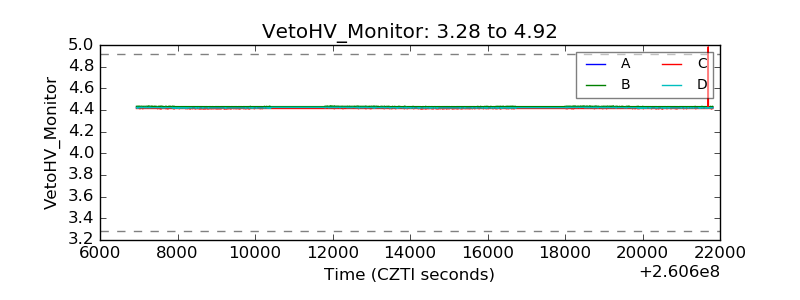 |
| Veto LLD |  |
| Alpha Counter | 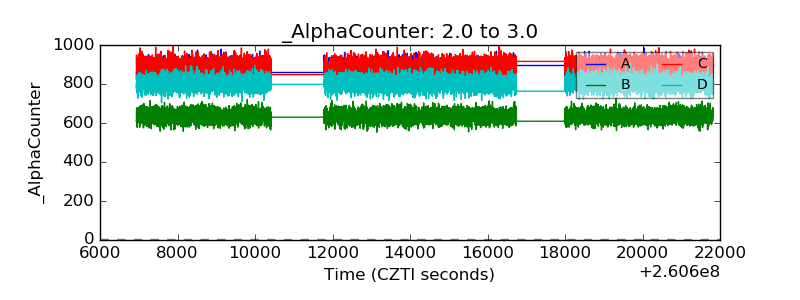 |
| _CPM_Rate |  |
| CZT Counter |  |
| +2.5 Volts monitor |  |
| +5 Volts monitor |  |
| _ROLL_ROT | 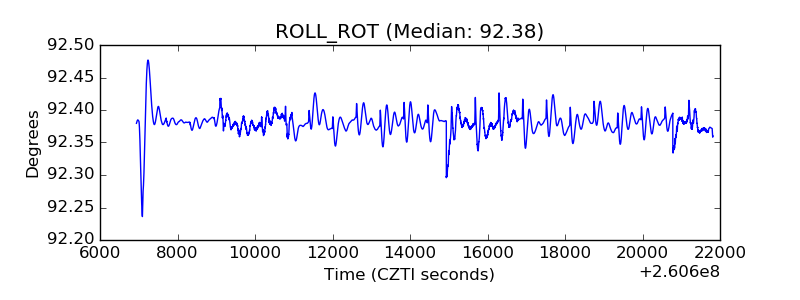 |
| _Roll_DEC | 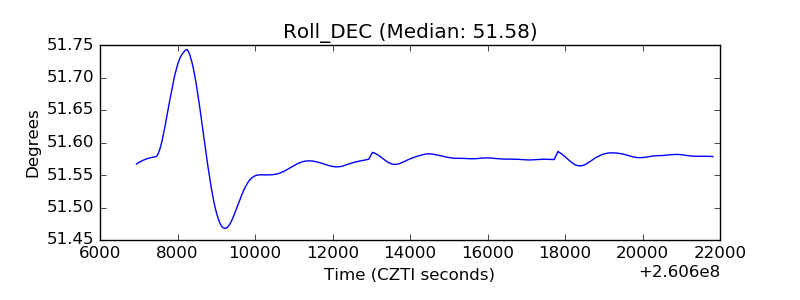 |
| _Roll_RA |  |
| Veto Counter | 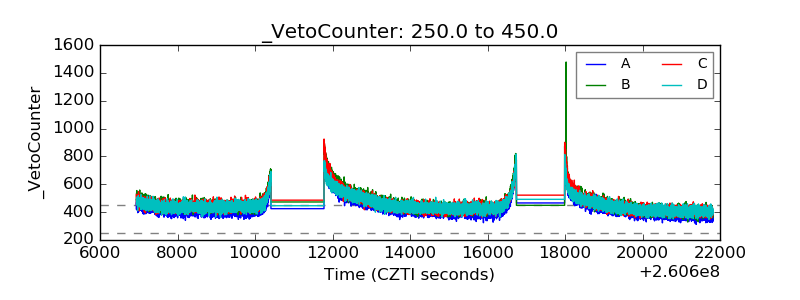 |