| Param | Original file | Final file |
|---|---|---|
| Filename | modeM0/AS1G08_029T01_9000002010cztM0_level2_bc.evt | modeM0/AS1G08_029T01_9000002010cztM0_level2_quad_clean.evt |
| Size (bytes) | 1,224,342,720 | 408,461,760 |
| Size | 1.1 GB | 389.5 MB |
| Events in quadrant A | 6,429,981 | 2,659,452 |
| Events in quadrant B | 8,285,367 | 2,639,381 |
| Events in quadrant C | 6,882,782 | 2,595,633 |
| Events in quadrant D | 13,424,051 | 2,406,140 |
| Mode M9 | |||
|---|---|---|---|
| Quadrant | BADHDUFLAG | Total packets | Discarded packets |
| A | 0 | 48 | 0 |
| B | 0 | 48 | 0 |
| C | 0 | 48 | 0 |
| D | 0 | 48 | 0 |
| Mode SS | |||
|---|---|---|---|
| Quadrant | BADHDUFLAG | Total packets | Discarded packets |
| A | 0 | 614 | 0 |
| B | 0 | 614 | 0 |
| C | 0 | 614 | 0 |
| D | 0 | 614 | 0 |
| Mode M0 | |||
|---|---|---|---|
| Quadrant | BADHDUFLAG | Total packets | Discarded packets |
| A | 0 | 63630 | 0 |
| B | 0 | 70592 | 0 |
| C | 0 | 63797 | 0 |
| D | 0 | 85746 | 0 |
| Quadrant | Total seconds | Saturated seconds | Saturation percentage |
|---|---|---|---|
| A | 30122 | 732 | 2.430118% |
| B | 30122 | 1070 | 3.552221% |
| C | 30122 | 493 | 1.636678% |
| D | 30122 | 2403 | 7.977558% |
Noise dominated data is calculated using 1-second bins in cleaned event files. If a bin has >2000 counts, and if more than 50% of those come from <1% of pixels, then it is considered to be noise-dominated and hence unusable.
| Quadrant | # 1 sec bins | Bins with >0 counts | Bins with >2000 counts | High rate bins dominated by noise | Noise dominated (total time) | Noise dominated (detector-on time) | Marked lightcurve |
|---|---|---|---|---|---|---|---|
| A | 33753 | 30123 | 0 | 0 | 0.00% | 0.00% | 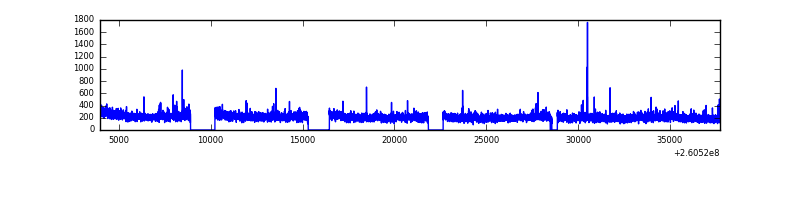 |
| B | 33752 | 30122 | 10 | 10 | 0.03% | 0.03% |  |
| C | 33752 | 30123 | 7 | 7 | 0.02% | 0.02% |  |
| D | 33753 | 30124 | 608 | 608 | 1.80% | 2.02% | 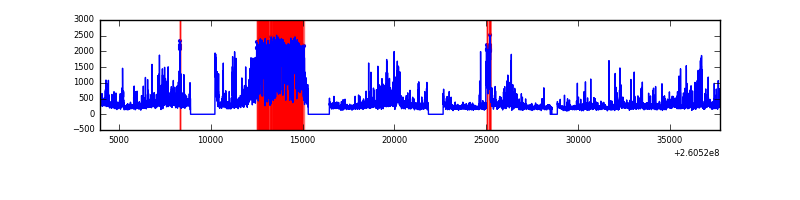 |
Top three noisy pixels from each quadrant. If the there are fewer than three noisy pixels in the level2.evt file, extra rows are filled as -1
| Pixel properties | Quadrant properties | ||||||
|---|---|---|---|---|---|---|---|
| Quadrant | DetID | PixID | Counts | Sigma | Mean | Median | Sigma |
| A | 1 | 162 | 71284 | 194.27 | 1634 | 1603 | 358.7 |
| A | 2 | 250 | 50274 | 135.69 | 1634 | 1603 | 358.7 |
| A | 15 | 69 | 19725 | 50.52 | 1634 | 1603 | 358.7 |
| B | 0 | 219 | 844586 | 2777.39 | 1620 | 1577 | 303.5 |
| B | 3 | 64 | 276032 | 904.22 | 1620 | 1577 | 303.5 |
| B | 3 | 209 | 155603 | 507.46 | 1620 | 1577 | 303.5 |
| C | 3 | 233 | 566165 | 1635.78 | 1573 | 1551 | 345.2 |
| C | 14 | 234 | 81242 | 230.88 | 1573 | 1551 | 345.2 |
| C | 0 | 207 | 67491 | 191.04 | 1573 | 1551 | 345.2 |
| D | 13 | 122 | 4464623 | 12360.32 | 1561 | 1503 | 361.1 |
| D | 8 | 195 | 1349142 | 3732.2 | 1561 | 1503 | 361.1 |
| D | 5 | 222 | 700688 | 1936.35 | 1561 | 1503 | 361.1 |
Histogram calculated using DETX and DETY for each event in the final _common_clean file
| Quadrant A |  |
 |
Quadrant B |
|---|---|---|---|
| Quadrant D |  |
 |
Quadrant C |
| Plot type | Count rate plots | Images |
|---|---|---|
| Comparison with Poisson distribution Blue bars denote a histogram of data divided into 1 sec bins. Red curve is a Poisson curve with rate = median count rate of data. |
 |
 |
| Quadrant-wise count rates Data is divided into 100 sec bins |
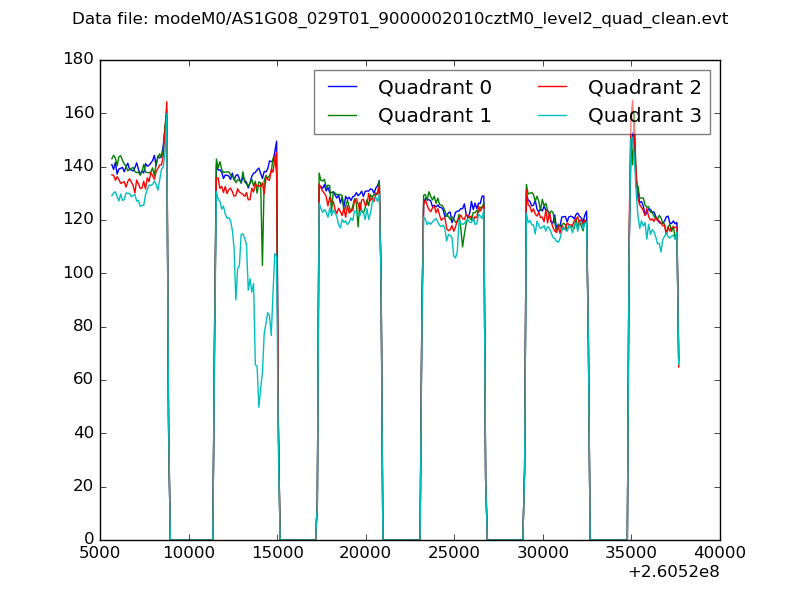 |
|
| Module-wise count rates for Quadrant A Data is divided into 100 sec bins |
 |
 |
| Module-wise count rates for Quadrant B Data is divided into 100 sec bins |
 |
 |
| Module-wise count rates for Quadrant C Data is divided into 100 sec bins |
 |
 |
| Module-wise count rates for Quadrant D Data is divided into 100 sec bins |
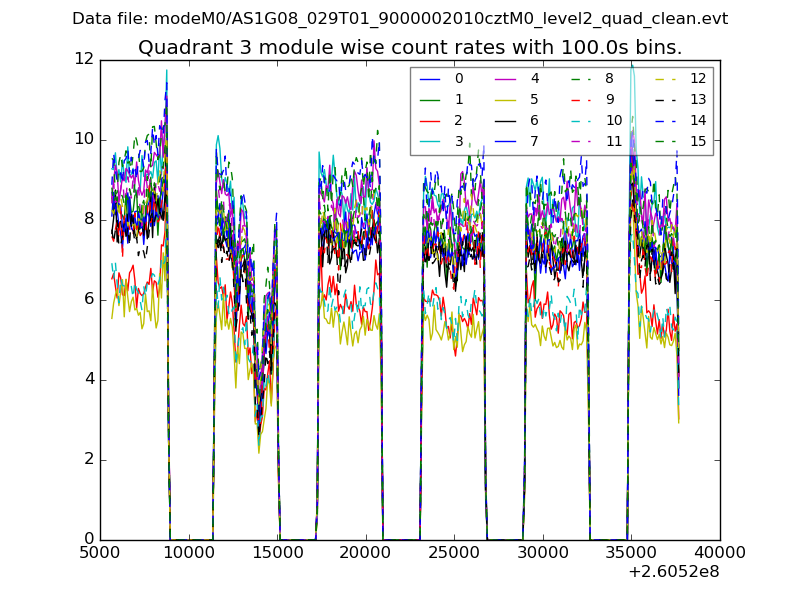 |
 |
| Parameter | Plot |
|---|---|
| CZT HV Monitor |  |
| D_VDD |  |
| Temperature 1 |  |
| Veto HV Monitor |  |
| Veto LLD |  |
| Alpha Counter | 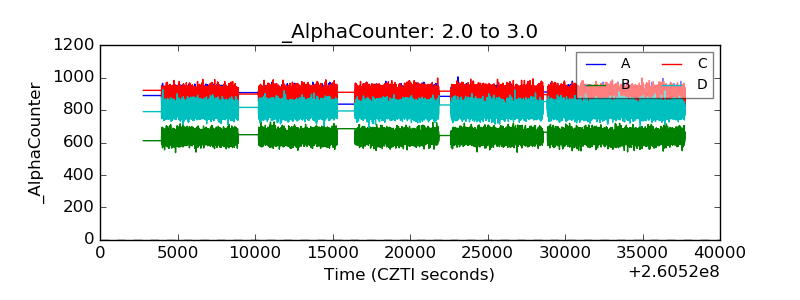 |
| _CPM_Rate |  |
| CZT Counter |  |
| +2.5 Volts monitor | 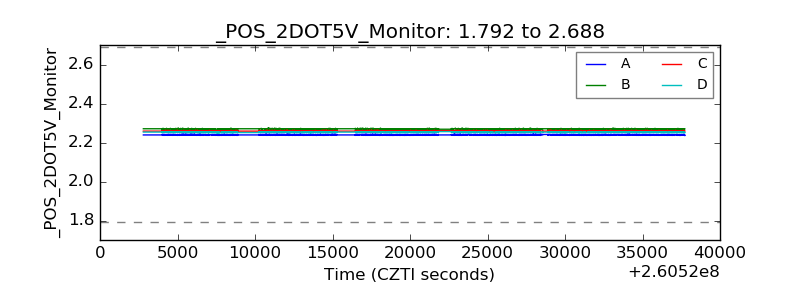 |
| +5 Volts monitor |  |
| _ROLL_ROT |  |
| _Roll_DEC |  |
| _Roll_RA |  |
| Veto Counter |  |