| Param | Original file | Final file |
|---|---|---|
| Filename | modeM0/AS1C03_015T02_9000002008cztM0_level2_bc.evt | modeM0/AS1C03_015T02_9000002008cztM0_level2_quad_clean.evt |
| Size (bytes) | 647,755,200 | 252,109,440 |
| Size | 617.7 MB | 240.4 MB |
| Events in quadrant A | 2,743,590 | 1,742,008 |
| Events in quadrant B | 3,745,349 | 1,760,687 |
| Events in quadrant C | 2,927,070 | 1,730,463 |
| Events in quadrant D | 9,312,758 | 1,507,069 |
| Mode M9 | |||
|---|---|---|---|
| Quadrant | BADHDUFLAG | Total packets | Discarded packets |
| A | 0 | 24 | 0 |
| B | 0 | 24 | 0 |
| C | 0 | 24 | 0 |
| D | 0 | 24 | 0 |
| Mode M0 | |||
|---|---|---|---|
| Quadrant | BADHDUFLAG | Total packets | Discarded packets |
| A | 0 | 26508 | 0 |
| B | 0 | 29915 | 0 |
| C | 0 | 26666 | 0 |
| D | 0 | 51746 | 0 |
| Mode SS | |||
|---|---|---|---|
| Quadrant | BADHDUFLAG | Total packets | Discarded packets |
| A | 0 | 262 | 0 |
| B | 0 | 262 | 0 |
| C | 0 | 262 | 0 |
| D | 0 | 262 | 0 |
| Quadrant | Total seconds | Saturated seconds | Saturation percentage |
|---|---|---|---|
| A | 12955 | 58 | 0.447704% |
| B | 12955 | 221 | 1.705905% |
| C | 12955 | 55 | 0.424547% |
| D | 12955 | 2593 | 20.015438% |
Noise dominated data is calculated using 1-second bins in cleaned event files. If a bin has >2000 counts, and if more than 50% of those come from <1% of pixels, then it is considered to be noise-dominated and hence unusable.
| Quadrant | # 1 sec bins | Bins with >0 counts | Bins with >2000 counts | High rate bins dominated by noise | Noise dominated (total time) | Noise dominated (detector-on time) | Marked lightcurve |
|---|---|---|---|---|---|---|---|
| A | 15416 | 12956 | 0 | 0 | 0.00% | 0.00% |  |
| B | 15416 | 12956 | 10 | 10 | 0.06% | 0.08% | 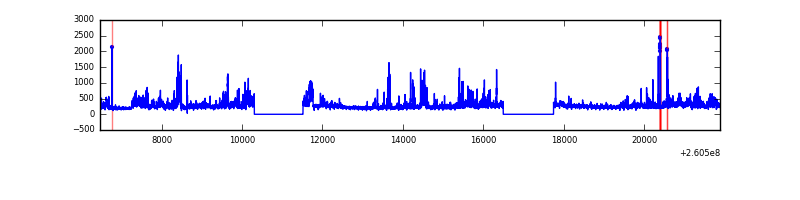 |
| C | 15416 | 12956 | 2 | 2 | 0.01% | 0.02% | 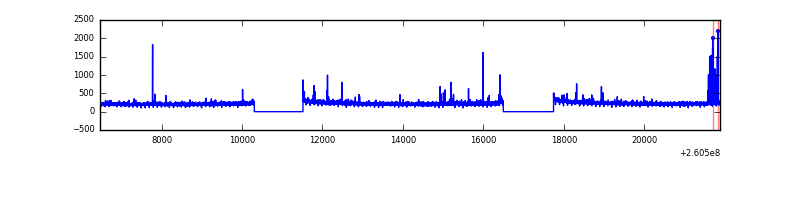 |
| D | 15416 | 12956 | 832 | 832 | 5.40% | 6.42% |  |
Top three noisy pixels from each quadrant. If the there are fewer than three noisy pixels in the level2.evt file, extra rows are filled as -1
| Pixel properties | Quadrant properties | ||||||
|---|---|---|---|---|---|---|---|
| Quadrant | DetID | PixID | Counts | Sigma | Mean | Median | Sigma |
| A | 1 | 162 | 37116 | 237.27 | 700 | 689 | 153.5 |
| A | 12 | 189 | 6864 | 40.22 | 700 | 689 | 153.5 |
| A | 12 | 194 | 4929 | 27.62 | 700 | 689 | 153.5 |
| B | 0 | 219 | 543384 | 4090.02 | 702 | 688 | 132.7 |
| B | 0 | 214 | 110278 | 825.92 | 702 | 688 | 132.7 |
| B | 4 | 173 | 61917 | 461.45 | 702 | 688 | 132.7 |
| C | 3 | 233 | 175396 | 1144.18 | 678 | 672 | 152.7 |
| C | 0 | 207 | 65048 | 421.57 | 678 | 672 | 152.7 |
| C | 14 | 234 | 23837 | 151.7 | 678 | 672 | 152.7 |
| D | 13 | 122 | 6051038 | 40724.61 | 633 | 612 | 148.6 |
| D | 8 | 195 | 323239 | 2171.56 | 633 | 612 | 148.6 |
| D | 5 | 222 | 185541 | 1244.73 | 633 | 612 | 148.6 |
Histogram calculated using DETX and DETY for each event in the final _common_clean file
| Quadrant A |  |
 |
Quadrant B |
|---|---|---|---|
| Quadrant D |  |
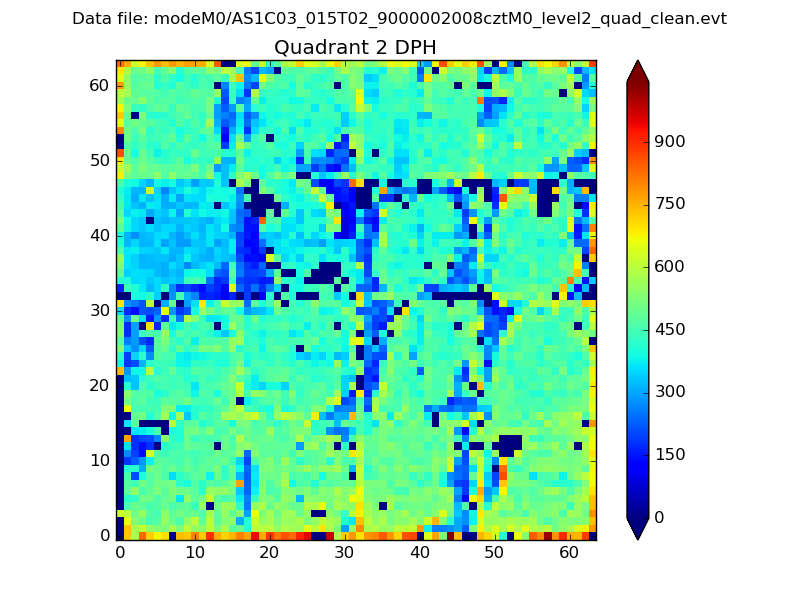 |
Quadrant C |
| Plot type | Count rate plots | Images |
|---|---|---|
| Comparison with Poisson distribution Blue bars denote a histogram of data divided into 1 sec bins. Red curve is a Poisson curve with rate = median count rate of data. |
 |
 |
| Quadrant-wise count rates Data is divided into 100 sec bins |
 |
|
| Module-wise count rates for Quadrant A Data is divided into 100 sec bins |
 |
 |
| Module-wise count rates for Quadrant B Data is divided into 100 sec bins |
 |
 |
| Module-wise count rates for Quadrant C Data is divided into 100 sec bins |
 |
 |
| Module-wise count rates for Quadrant D Data is divided into 100 sec bins |
 |
 |
| Parameter | Plot |
|---|---|
| CZT HV Monitor |  |
| D_VDD |  |
| Temperature 1 |  |
| Veto HV Monitor |  |
| Veto LLD |  |
| Alpha Counter |  |
| _CPM_Rate |  |
| CZT Counter | 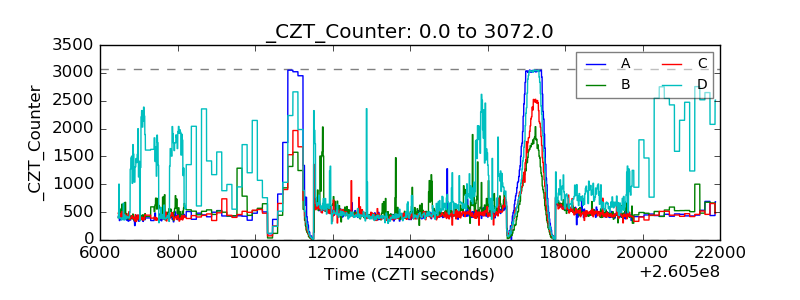 |
| +2.5 Volts monitor |  |
| +5 Volts monitor |  |
| _ROLL_ROT |  |
| _Roll_DEC | 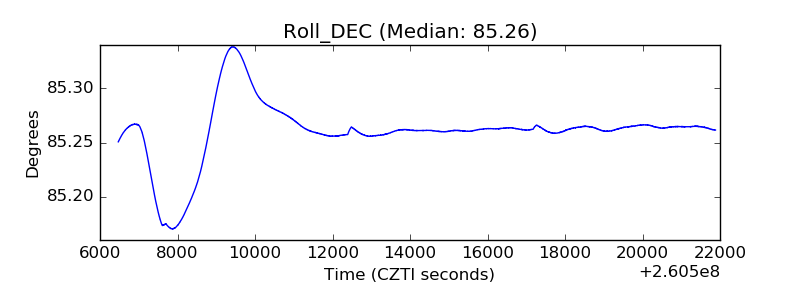 |
| _Roll_RA |  |
| Veto Counter |  |