| Param | Original file | Final file |
|---|---|---|
| Filename | modeM0/AS1A04_012T01_9000002012cztM0_level2_bc.evt | modeM0/AS1A04_012T01_9000002012cztM0_level2_quad_clean.evt |
| Size (bytes) | 740,162,880 | 238,250,880 |
| Size | 705.9 MB | 227.2 MB |
| Events in quadrant A | 4,050,479 | 1,480,779 |
| Events in quadrant B | 4,925,405 | 1,469,986 |
| Events in quadrant C | 4,477,398 | 1,462,832 |
| Events in quadrant D | 7,541,278 | 1,371,706 |
| Mode M0 | |||
|---|---|---|---|
| Quadrant | BADHDUFLAG | Total packets | Discarded packets |
| A | 0 | 42865 | 0 |
| B | 0 | 45933 | 0 |
| C | 0 | 42974 | 0 |
| D | 0 | 53592 | 0 |
| Mode SS | |||
|---|---|---|---|
| Quadrant | BADHDUFLAG | Total packets | Discarded packets |
| A | 0 | 424 | 0 |
| B | 0 | 424 | 0 |
| C | 0 | 424 | 0 |
| D | 0 | 424 | 0 |
| Mode M9 | |||
|---|---|---|---|
| Quadrant | BADHDUFLAG | Total packets | Discarded packets |
| A | 0 | 23 | 0 |
| B | 0 | 23 | 0 |
| C | 0 | 23 | 0 |
| D | 0 | 23 | 0 |
| Quadrant | Total seconds | Saturated seconds | Saturation percentage |
|---|---|---|---|
| A | 20768 | 182 | 0.876348% |
| B | 20768 | 333 | 1.603428% |
| C | 20768 | 135 | 0.650039% |
| D | 20768 | 798 | 3.842450% |
Noise dominated data is calculated using 1-second bins in cleaned event files. If a bin has >2000 counts, and if more than 50% of those come from <1% of pixels, then it is considered to be noise-dominated and hence unusable.
| Quadrant | # 1 sec bins | Bins with >0 counts | Bins with >2000 counts | High rate bins dominated by noise | Noise dominated (total time) | Noise dominated (detector-on time) | Marked lightcurve |
|---|---|---|---|---|---|---|---|
| A | 23054 | 20771 | 0 | 0 | 0.00% | 0.00% |  |
| B | 23054 | 20769 | 42 | 42 | 0.18% | 0.20% |  |
| C | 23054 | 20770 | 1 | 1 | 0.00% | 0.00% |  |
| D | 23054 | 20769 | 45 | 45 | 0.20% | 0.22% | 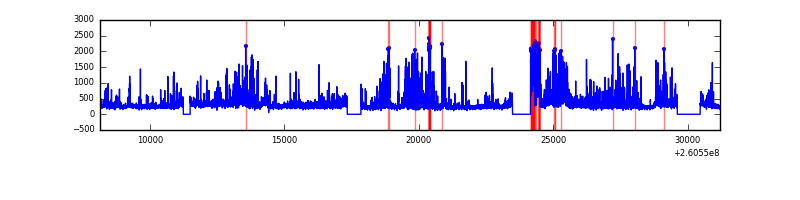 |
Top three noisy pixels from each quadrant. If the there are fewer than three noisy pixels in the level2.evt file, extra rows are filled as -1
| Pixel properties | Quadrant properties | ||||||
|---|---|---|---|---|---|---|---|
| Quadrant | DetID | PixID | Counts | Sigma | Mean | Median | Sigma |
| A | 15 | 69 | 44291 | 188.79 | 1031 | 1006 | 229.3 |
| A | 1 | 162 | 37792 | 160.44 | 1031 | 1006 | 229.3 |
| A | 0 | 226 | 7135 | 26.73 | 1031 | 1006 | 229.3 |
| B | 0 | 219 | 439408 | 2179.12 | 1024 | 991 | 201.2 |
| B | 3 | 64 | 200488 | 991.58 | 1024 | 991 | 201.2 |
| B | 10 | 244 | 75468 | 370.18 | 1024 | 991 | 201.2 |
| C | 3 | 233 | 465530 | 2059.65 | 1007 | 991 | 225.5 |
| C | 14 | 234 | 39155 | 169.21 | 1007 | 991 | 225.5 |
| C | 0 | 207 | 14160 | 58.39 | 1007 | 991 | 225.5 |
| D | 5 | 222 | 2421440 | 9954.2 | 1008 | 966 | 243.2 |
| D | 8 | 195 | 871723 | 3580.99 | 1008 | 966 | 243.2 |
| D | 13 | 249 | 177812 | 727.28 | 1008 | 966 | 243.2 |
Histogram calculated using DETX and DETY for each event in the final _common_clean file
| Quadrant A |  |
 |
Quadrant B |
|---|---|---|---|
| Quadrant D |  |
 |
Quadrant C |
| Plot type | Count rate plots | Images |
|---|---|---|
| Comparison with Poisson distribution Blue bars denote a histogram of data divided into 1 sec bins. Red curve is a Poisson curve with rate = median count rate of data. |
 |
 |
| Quadrant-wise count rates Data is divided into 100 sec bins |
 |
|
| Module-wise count rates for Quadrant A Data is divided into 100 sec bins |
 |
 |
| Module-wise count rates for Quadrant B Data is divided into 100 sec bins |
 |
 |
| Module-wise count rates for Quadrant C Data is divided into 100 sec bins |
 |
 |
| Module-wise count rates for Quadrant D Data is divided into 100 sec bins |
 |
 |
| Parameter | Plot |
|---|---|
| CZT HV Monitor |  |
| D_VDD |  |
| Temperature 1 |  |
| Veto HV Monitor |  |
| Veto LLD |  |
| Alpha Counter |  |
| _CPM_Rate |  |
| CZT Counter | 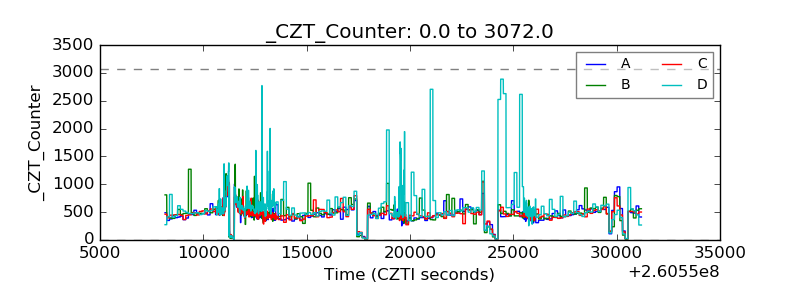 |
| +2.5 Volts monitor |  |
| +5 Volts monitor | 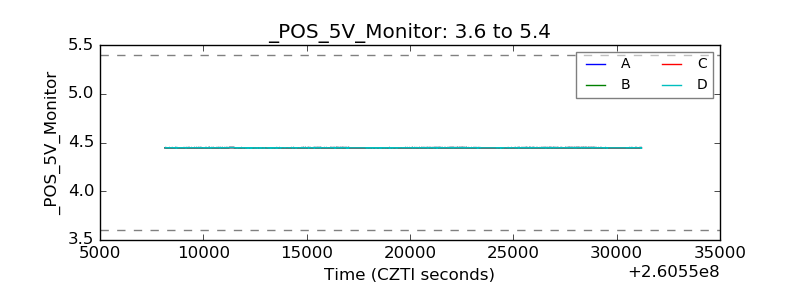 |
| _ROLL_ROT |  |
| _Roll_DEC | 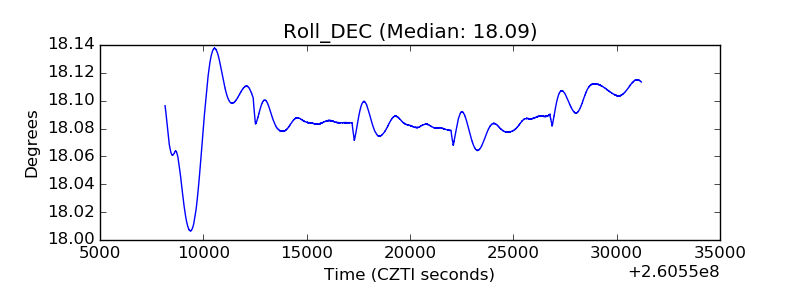 |
| _Roll_RA |  |
| Veto Counter | 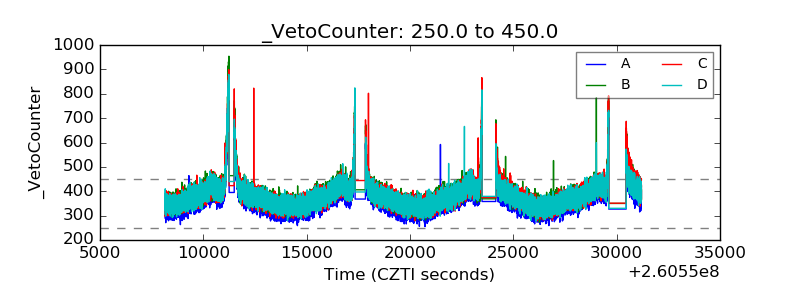 |