| Param | Original file | Final file |
|---|---|---|
| Filename | modeM0/AS1G08_028T01_9000002006cztM0_level2_bc.evt | modeM0/AS1G08_028T01_9000002006cztM0_level2_quad_clean.evt |
| Size (bytes) | 1,301,627,520 | 365,725,440 |
| Size | 1.2 GB | 348.8 MB |
| Events in quadrant A | 5,733,629 | 2,355,598 |
| Events in quadrant B | 8,015,644 | 2,334,633 |
| Events in quadrant C | 6,309,391 | 2,340,885 |
| Events in quadrant D | 17,447,704 | 2,118,622 |
| Mode SS | |||
|---|---|---|---|
| Quadrant | BADHDUFLAG | Total packets | Discarded packets |
| A | 0 | 570 | 0 |
| B | 0 | 570 | 0 |
| C | 0 | 570 | 0 |
| D | 0 | 570 | 0 |
| Mode M0 | |||
|---|---|---|---|
| Quadrant | BADHDUFLAG | Total packets | Discarded packets |
| A | 0 | 57854 | 0 |
| B | 0 | 67719 | 0 |
| C | 0 | 58235 | 0 |
| D | 0 | 105629 | 0 |
| Mode M9 | |||
|---|---|---|---|
| Quadrant | BADHDUFLAG | Total packets | Discarded packets |
| A | 0 | 38 | 0 |
| B | 0 | 38 | 0 |
| C | 0 | 38 | 0 |
| D | 0 | 38 | 0 |
| Quadrant | Total seconds | Saturated seconds | Saturation percentage |
|---|---|---|---|
| A | 28028 | 151 | 0.538747% |
| B | 28028 | 813 | 2.900671% |
| C | 28028 | 147 | 0.524476% |
| D | 28028 | 4900 | 17.482517% |
Noise dominated data is calculated using 1-second bins in cleaned event files. If a bin has >2000 counts, and if more than 50% of those come from <1% of pixels, then it is considered to be noise-dominated and hence unusable.
| Quadrant | # 1 sec bins | Bins with >0 counts | Bins with >2000 counts | High rate bins dominated by noise | Noise dominated (total time) | Noise dominated (detector-on time) | Marked lightcurve |
|---|---|---|---|---|---|---|---|
| A | 31799 | 28029 | 5 | 5 | 0.02% | 0.02% |  |
| B | 31799 | 28029 | 11 | 11 | 0.03% | 0.04% |  |
| C | 31799 | 28029 | 0 | 0 | 0.00% | 0.00% | 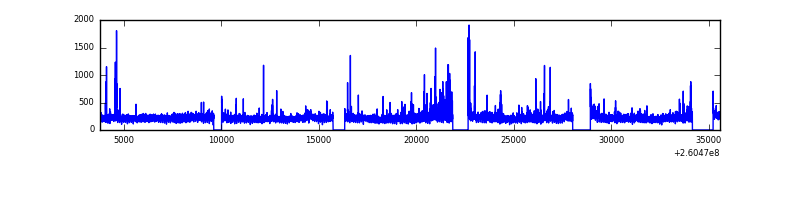 |
| D | 31799 | 28032 | 560 | 560 | 1.76% | 2.00% |  |
Top three noisy pixels from each quadrant. If the there are fewer than three noisy pixels in the level2.evt file, extra rows are filled as -1
| Pixel properties | Quadrant properties | ||||||
|---|---|---|---|---|---|---|---|
| Quadrant | DetID | PixID | Counts | Sigma | Mean | Median | Sigma |
| A | 1 | 162 | 77569 | 233.91 | 1439 | 1406 | 325.6 |
| A | 15 | 69 | 69074 | 207.82 | 1439 | 1406 | 325.6 |
| A | 15 | 157 | 20863 | 59.76 | 1439 | 1406 | 325.6 |
| B | 0 | 219 | 844684 | 2994.76 | 1425 | 1385 | 281.6 |
| B | 0 | 182 | 719636 | 2550.68 | 1425 | 1385 | 281.6 |
| B | 3 | 64 | 381357 | 1349.37 | 1425 | 1385 | 281.6 |
| C | 3 | 233 | 674956 | 2136.55 | 1405 | 1389 | 315.3 |
| C | 0 | 207 | 65100 | 202.09 | 1405 | 1389 | 315.3 |
| C | 8 | 128 | 18999 | 55.86 | 1405 | 1389 | 315.3 |
| D | 13 | 122 | 8680503 | 27812.01 | 1313 | 1268 | 312.1 |
| D | 5 | 222 | 2538109 | 8129.13 | 1313 | 1268 | 312.1 |
| D | 8 | 195 | 629029 | 2011.62 | 1313 | 1268 | 312.1 |
Histogram calculated using DETX and DETY for each event in the final _common_clean file
| Quadrant A | 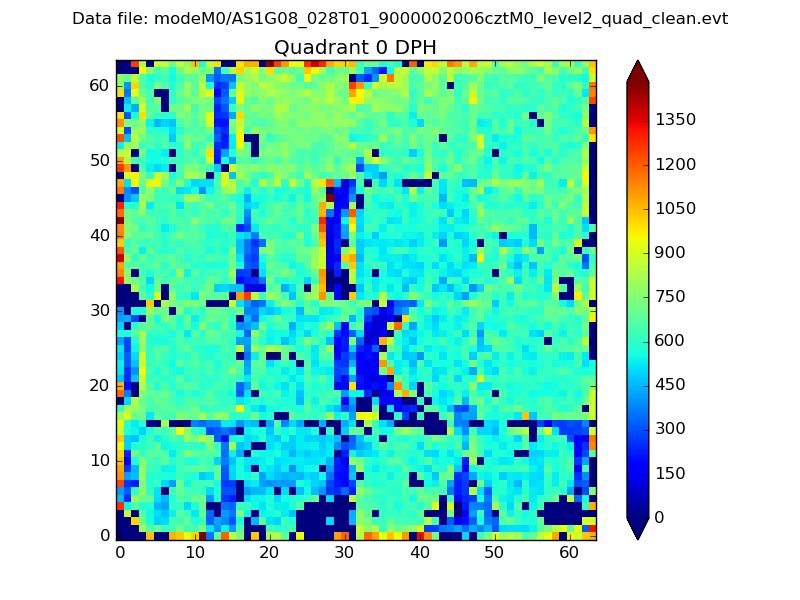 |
 |
Quadrant B |
|---|---|---|---|
| Quadrant D | 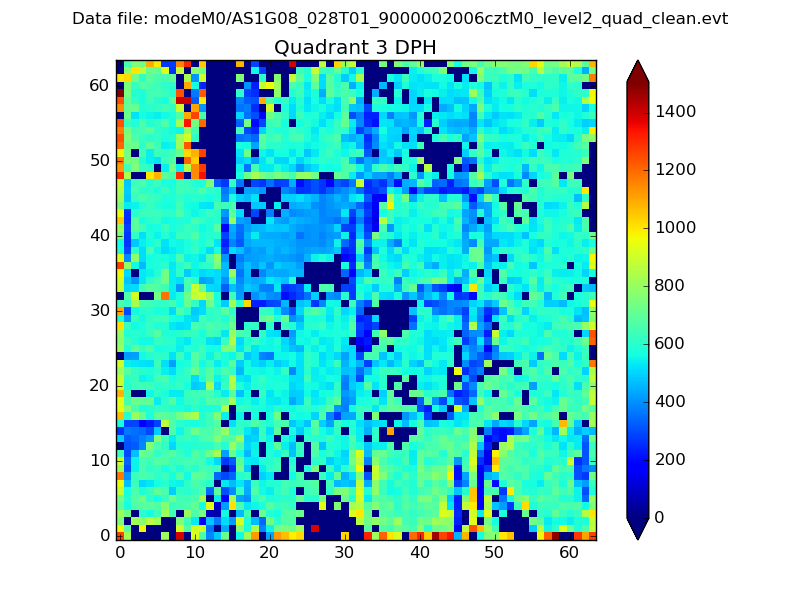 |
 |
Quadrant C |
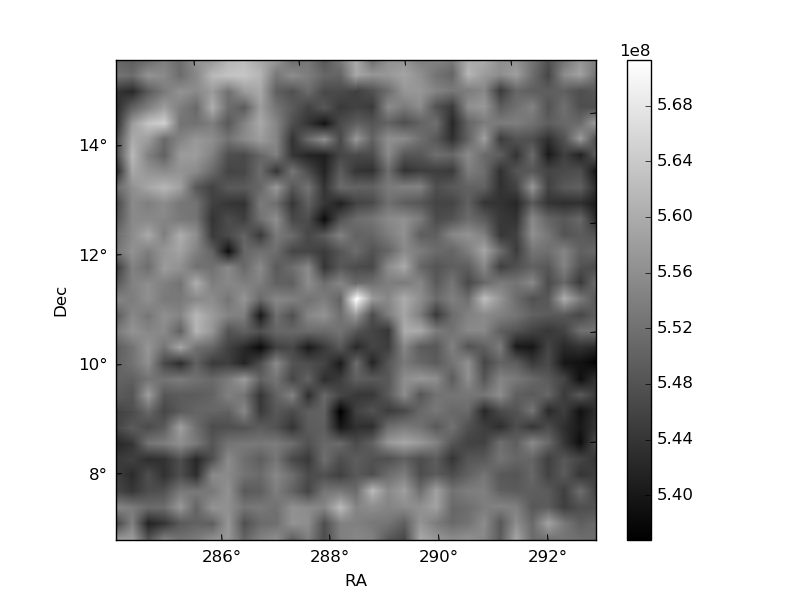
| Plot type | Count rate plots | Images |
|---|---|---|
| Comparison with Poisson distribution Blue bars denote a histogram of data divided into 1 sec bins. Red curve is a Poisson curve with rate = median count rate of data. |
 |
 |
| Quadrant-wise count rates Data is divided into 100 sec bins |
 |
|
| Module-wise count rates for Quadrant A Data is divided into 100 sec bins |
 |
 |
| Module-wise count rates for Quadrant B Data is divided into 100 sec bins |
 |
 |
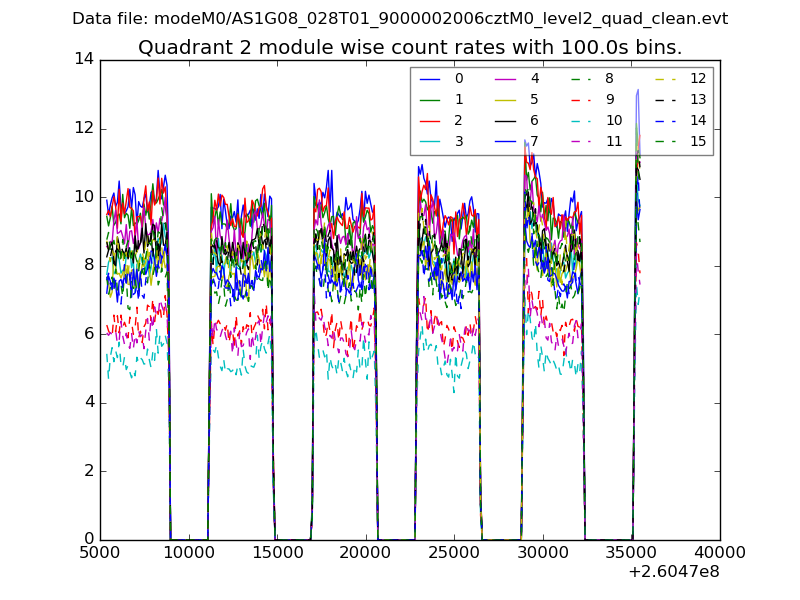
| Module-wise count rates for Quadrant C Data is divided into 100 sec bins |
 |
 |
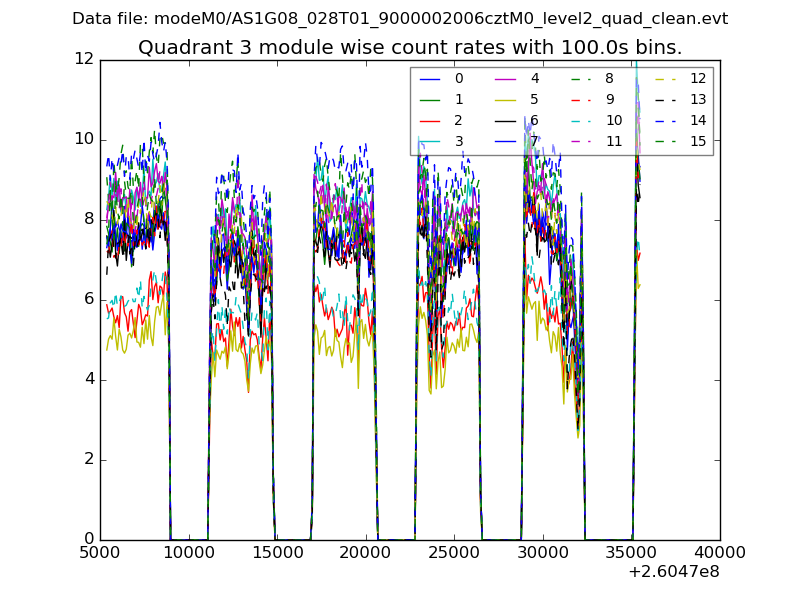
| Module-wise count rates for Quadrant D Data is divided into 100 sec bins |
 |
 |
| Parameter | Plot |
|---|---|
| CZT HV Monitor |  |
| D_VDD |  |
| Temperature 1 | 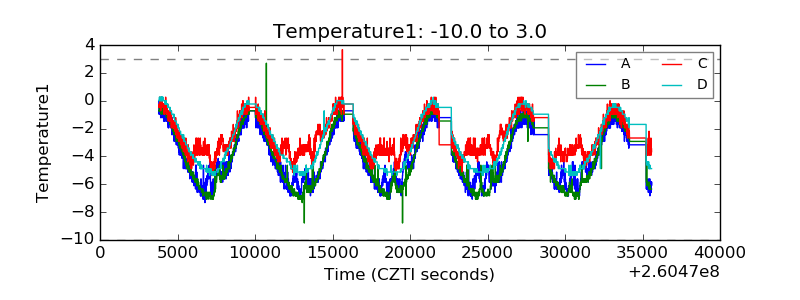 |
| Veto HV Monitor | 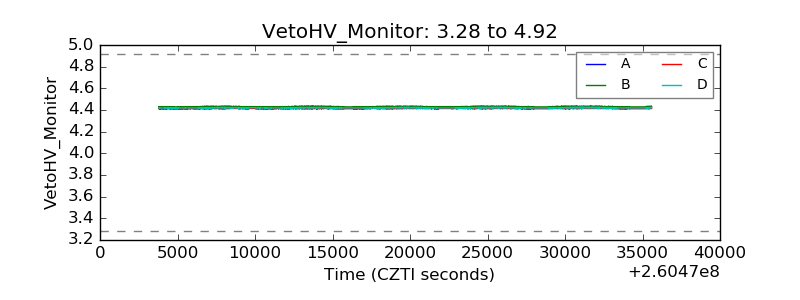 |
| Veto LLD |  |
| Alpha Counter |  |
| _CPM_Rate |  |
| CZT Counter |  |
| +2.5 Volts monitor |  |
| +5 Volts monitor |  |
| _ROLL_ROT |  |
| _Roll_DEC |  |
| _Roll_RA |  |
| Veto Counter |  |