| Param | Original file | Final file |
|---|---|---|
| Filename | modeM0/AS1G08_047T01_9000002002cztM0_level2_bc.evt | modeM0/AS1G08_047T01_9000002002cztM0_level2_quad_clean.evt |
| Size (bytes) | 2,746,632,960 | 1,004,284,800 |
| Size | 2.6 GB | 957.8 MB |
| Events in quadrant A | 15,920,431 | 6,368,346 |
| Events in quadrant B | 19,812,894 | 6,377,618 |
| Events in quadrant C | 18,454,109 | 6,347,880 |
| Events in quadrant D | 23,750,862 | 6,048,944 |
| Mode M0 | |||
|---|---|---|---|
| Quadrant | BADHDUFLAG | Total packets | Discarded packets |
| A | 0 | 159689 | 0 |
| B | 0 | 174389 | 0 |
| C | 0 | 162868 | 0 |
| D | 0 | 183695 | 0 |
| Mode SS | |||
|---|---|---|---|
| Quadrant | BADHDUFLAG | Total packets | Discarded packets |
| A | 0 | 1568 | 0 |
| B | 0 | 1568 | 0 |
| C | 0 | 1568 | 0 |
| D | 0 | 1568 | 0 |
| Mode M9 | |||
|---|---|---|---|
| Quadrant | BADHDUFLAG | Total packets | Discarded packets |
| A | 0 | 117 | 0 |
| B | 0 | 117 | 0 |
| C | 0 | 117 | 0 |
| D | 0 | 117 | 0 |
| Quadrant | Total seconds | Saturated seconds | Saturation percentage |
|---|---|---|---|
| A | 76959 | 705 | 0.916072% |
| B | 76959 | 2055 | 2.670253% |
| C | 76959 | 577 | 0.749750% |
| D | 76959 | 1861 | 2.418171% |
Noise dominated data is calculated using 1-second bins in cleaned event files. If a bin has >2000 counts, and if more than 50% of those come from <1% of pixels, then it is considered to be noise-dominated and hence unusable.
| Quadrant | # 1 sec bins | Bins with >0 counts | Bins with >2000 counts | High rate bins dominated by noise | Noise dominated (total time) | Noise dominated (detector-on time) | Marked lightcurve |
|---|---|---|---|---|---|---|---|
| A | 88685 | 76951 | 2 | 2 | 0.00% | 0.00% |  |
| B | 88685 | 76949 | 101 | 101 | 0.11% | 0.13% |  |
| C | 88685 | 76953 | 2 | 2 | 0.00% | 0.00% |  |
| D | 88685 | 76948 | 116 | 116 | 0.13% | 0.15% |  |
Top three noisy pixels from each quadrant. If the there are fewer than three noisy pixels in the level2.evt file, extra rows are filled as -1
| Pixel properties | Quadrant properties | ||||||
|---|---|---|---|---|---|---|---|
| Quadrant | DetID | PixID | Counts | Sigma | Mean | Median | Sigma |
| A | 1 | 162 | 162401 | 180.61 | 4038 | 3958 | 877.3 |
| A | 15 | 69 | 57682 | 61.24 | 4038 | 3958 | 877.3 |
| A | 2 | 250 | 54403 | 57.5 | 4038 | 3958 | 877.3 |
| B | 0 | 182 | 1970506 | 2564.07 | 4050 | 3946 | 767.0 |
| B | 3 | 64 | 815501 | 1058.14 | 4050 | 3946 | 767.0 |
| B | 4 | 142 | 285707 | 367.37 | 4050 | 3946 | 767.0 |
| C | 3 | 233 | 2898364 | 3387.31 | 3945 | 3901 | 854.5 |
| C | 0 | 207 | 49760 | 53.67 | 3945 | 3901 | 854.5 |
| C | 14 | 234 | 46555 | 49.92 | 3945 | 3901 | 854.5 |
| D | 5 | 222 | 2253502 | 2453.08 | 3963 | 3819 | 917.1 |
| D | 8 | 195 | 1529204 | 1663.29 | 3963 | 3819 | 917.1 |
| D | 1 | 20 | 1424144 | 1548.74 | 3963 | 3819 | 917.1 |
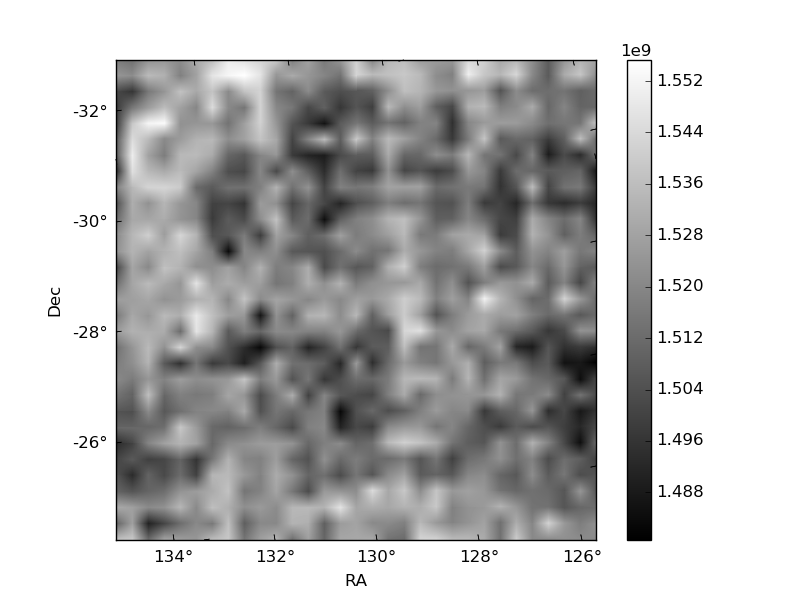
Histogram calculated using DETX and DETY for each event in the final _common_clean file
| Quadrant A |  |
 |
Quadrant B |
|---|---|---|---|
| Quadrant D | 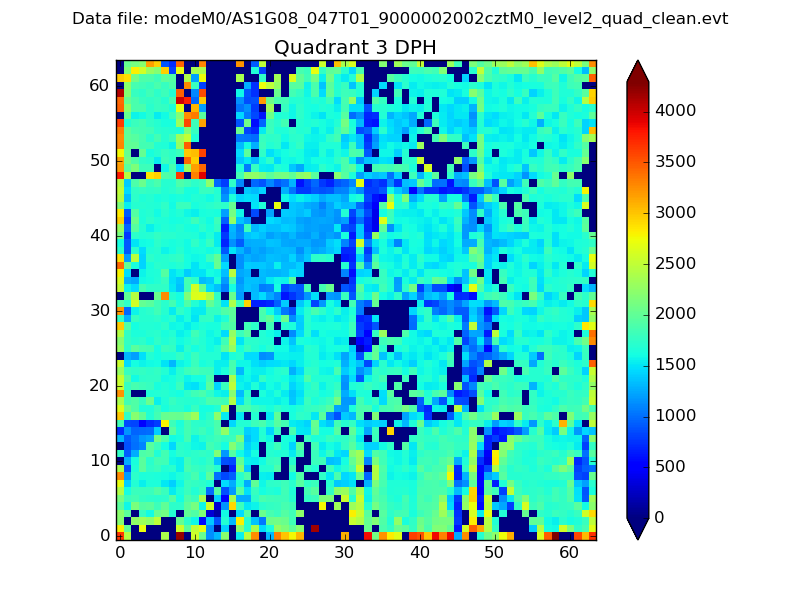 |
 |
Quadrant C |
| Plot type | Count rate plots | Images |
|---|---|---|
| Comparison with Poisson distribution Blue bars denote a histogram of data divided into 1 sec bins. Red curve is a Poisson curve with rate = median count rate of data. |
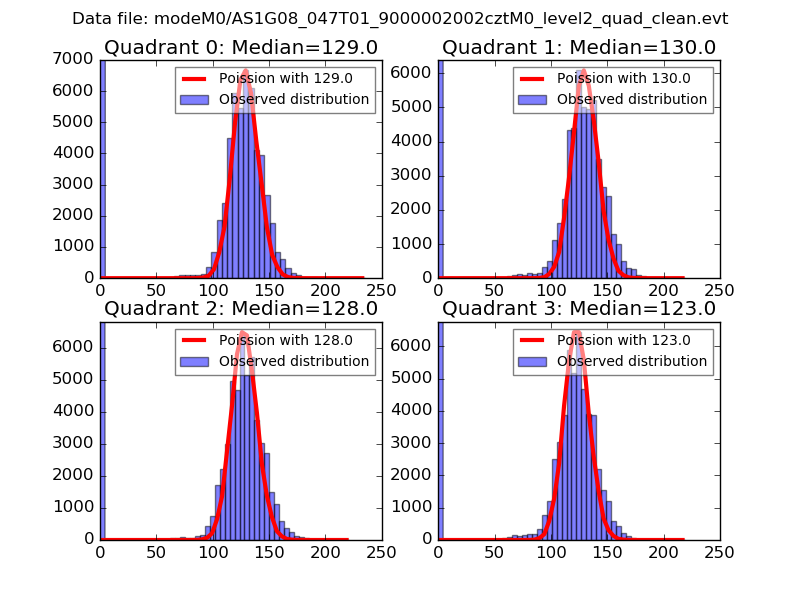 |
 |
| Quadrant-wise count rates Data is divided into 100 sec bins |
 |
|
| Module-wise count rates for Quadrant A Data is divided into 100 sec bins |
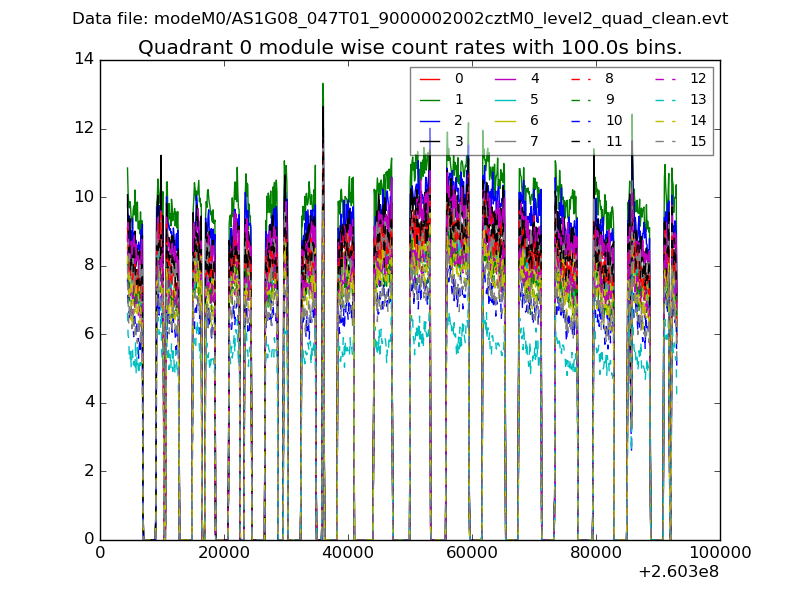 |
 |
| Module-wise count rates for Quadrant B Data is divided into 100 sec bins |
 |
 |
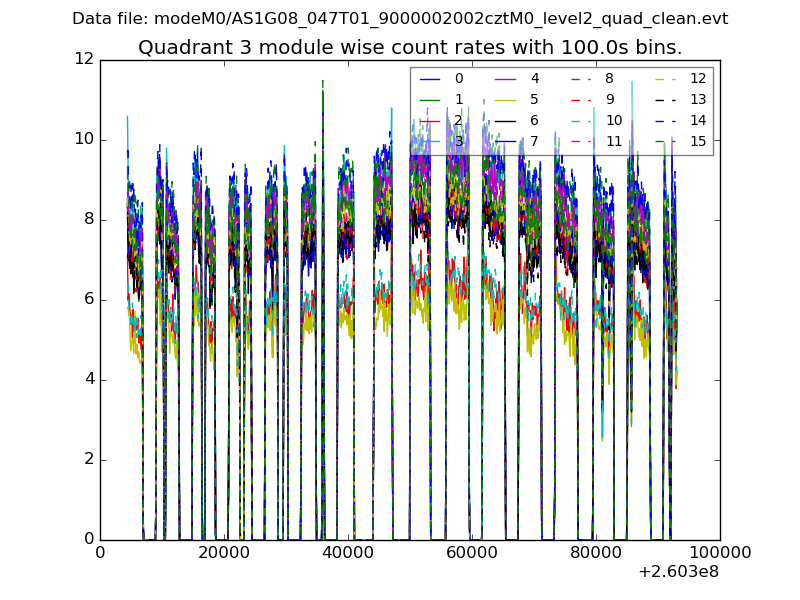
| Module-wise count rates for Quadrant C Data is divided into 100 sec bins |
 |
 |
| Module-wise count rates for Quadrant D Data is divided into 100 sec bins |
 |
 |
| Parameter | Plot |
|---|---|
| CZT HV Monitor |  |
| D_VDD |  |
| Temperature 1 |  |
| Veto HV Monitor |  |
| Veto LLD |  |
| Alpha Counter |  |
| _CPM_Rate |  |
| CZT Counter |  |
| +2.5 Volts monitor |  |
| +5 Volts monitor |  |
| _ROLL_ROT |  |
| _Roll_DEC |  |
| _Roll_RA | 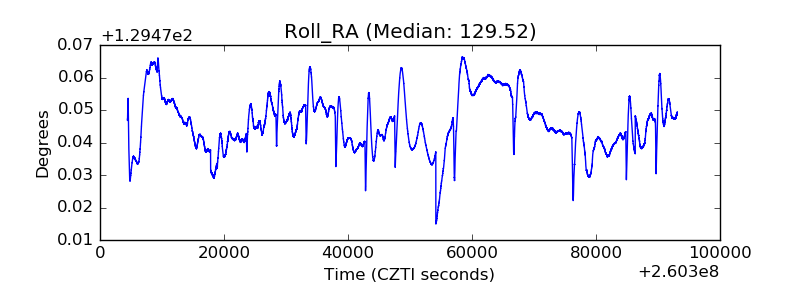 |
| Veto Counter |  |