| Param | Original file | Final file |
|---|---|---|
| Filename | modeM0/AS1A04_180T01_9000002000cztM0_level2_bc.evt | modeM0/AS1A04_180T01_9000002000cztM0_level2_quad_clean.evt |
| Size (bytes) | 1,832,166,720 | 604,080,000 |
| Size | 1.7 GB | 576.1 MB |
| Events in quadrant A | 10,351,878 | 3,843,817 |
| Events in quadrant B | 11,424,360 | 3,840,103 |
| Events in quadrant C | 12,067,809 | 3,790,623 |
| Events in quadrant D | 18,404,814 | 3,561,523 |
| Mode M0 | |||
|---|---|---|---|
| Quadrant | BADHDUFLAG | Total packets | Discarded packets |
| A | 0 | 99110 | 0 |
| B | 0 | 103013 | 0 |
| C | 0 | 101583 | 0 |
| D | 0 | 128608 | 0 |
| Mode SS | |||
|---|---|---|---|
| Quadrant | BADHDUFLAG | Total packets | Discarded packets |
| A | 0 | 968 | 0 |
| B | 0 | 968 | 0 |
| C | 0 | 968 | 0 |
| D | 0 | 968 | 0 |
| Mode M9 | |||
|---|---|---|---|
| Quadrant | BADHDUFLAG | Total packets | Discarded packets |
| A | 0 | 91 | 0 |
| B | 0 | 91 | 0 |
| C | 0 | 91 | 0 |
| D | 0 | 91 | 0 |
| Quadrant | Total seconds | Saturated seconds | Saturation percentage |
|---|---|---|---|
| A | 47507 | 639 | 1.345065% |
| B | 47507 | 862 | 1.814469% |
| C | 47507 | 537 | 1.130360% |
| D | 47507 | 2373 | 4.995053% |
Noise dominated data is calculated using 1-second bins in cleaned event files. If a bin has >2000 counts, and if more than 50% of those come from <1% of pixels, then it is considered to be noise-dominated and hence unusable.
| Quadrant | # 1 sec bins | Bins with >0 counts | Bins with >2000 counts | High rate bins dominated by noise | Noise dominated (total time) | Noise dominated (detector-on time) | Marked lightcurve |
|---|---|---|---|---|---|---|---|
| A | 56568 | 47501 | 5 | 5 | 0.01% | 0.01% |  |
| B | 56568 | 47500 | 30 | 30 | 0.05% | 0.06% |  |
| C | 56568 | 47503 | 2 | 2 | 0.00% | 0.00% |  |
| D | 56568 | 47500 | 174 | 174 | 0.31% | 0.37% |  |
Top three noisy pixels from each quadrant. If the there are fewer than three noisy pixels in the level2.evt file, extra rows are filled as -1
| Pixel properties | Quadrant properties | ||||||
|---|---|---|---|---|---|---|---|
| Quadrant | DetID | PixID | Counts | Sigma | Mean | Median | Sigma |
| A | 1 | 162 | 81688 | 139.29 | 2613 | 2567 | 568.0 |
| A | 4 | 2 | 72488 | 123.09 | 2613 | 2567 | 568.0 |
| A | 9 | 143 | 57847 | 97.32 | 2613 | 2567 | 568.0 |
| B | 3 | 64 | 440943 | 895.33 | 2600 | 2532 | 489.7 |
| B | 3 | 209 | 232653 | 469.96 | 2600 | 2532 | 489.7 |
| B | 0 | 189 | 111861 | 223.27 | 2600 | 2532 | 489.7 |
| C | 3 | 233 | 2071159 | 3746.91 | 2528 | 2508 | 552.1 |
| C | 0 | 207 | 36047 | 60.75 | 2528 | 2508 | 552.1 |
| C | 7 | 238 | 28976 | 47.94 | 2528 | 2508 | 552.1 |
| D | 5 | 222 | 3180511 | 5460.77 | 2517 | 2440 | 582.0 |
| D | 8 | 195 | 1748577 | 3000.33 | 2517 | 2440 | 582.0 |
| D | 13 | 122 | 911502 | 1562.01 | 2517 | 2440 | 582.0 |
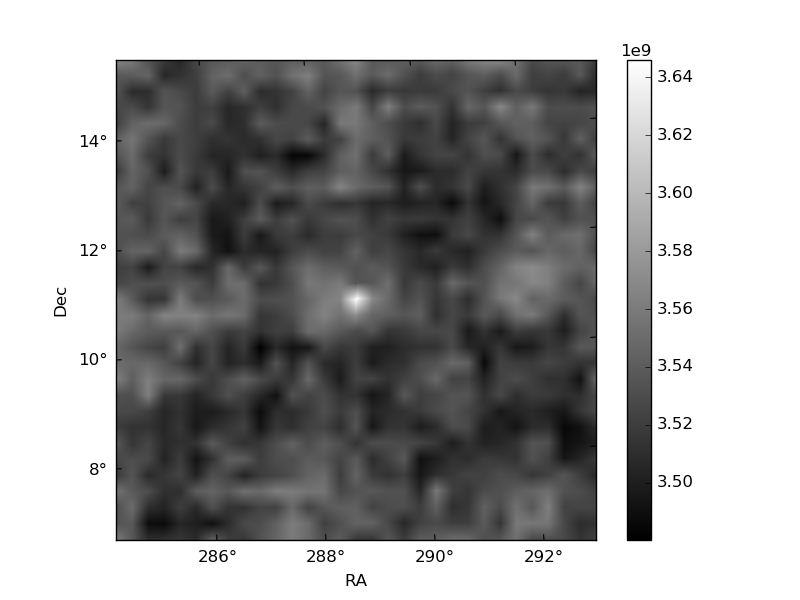
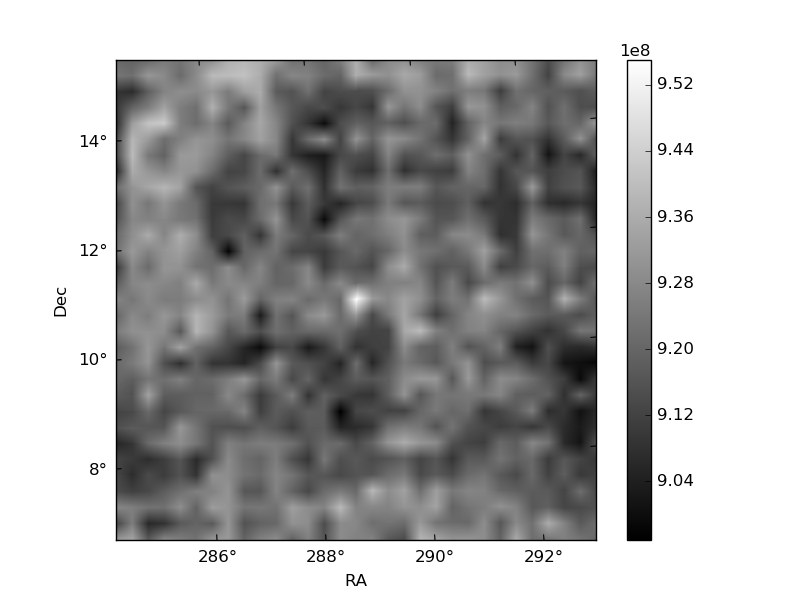
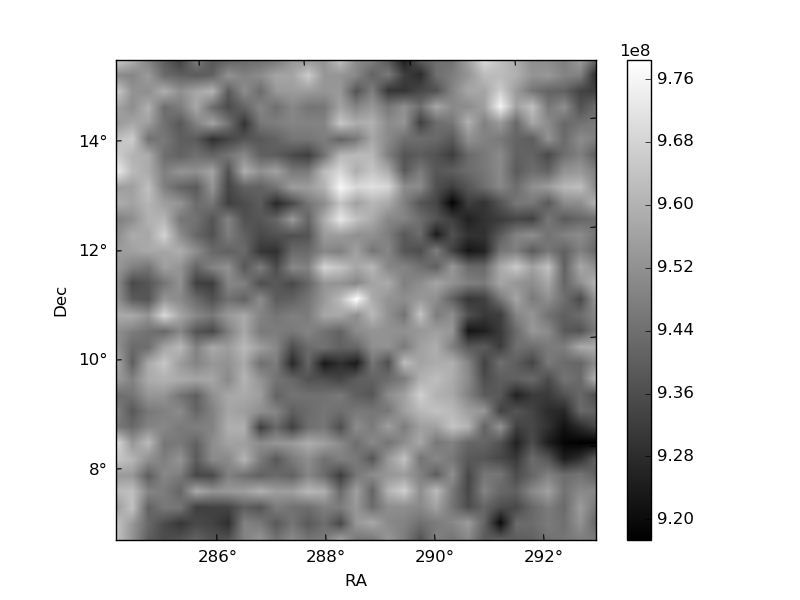
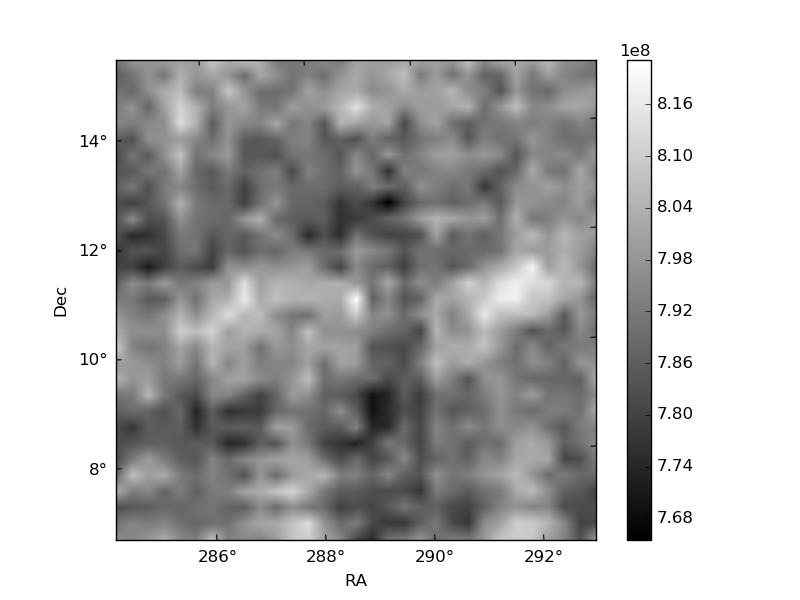
Histogram calculated using DETX and DETY for each event in the final _common_clean file
| Quadrant A |  |
 |
Quadrant B |
|---|---|---|---|
| Quadrant D |  |
 |
Quadrant C |
| Plot type | Count rate plots | Images |
|---|---|---|
| Comparison with Poisson distribution Blue bars denote a histogram of data divided into 1 sec bins. Red curve is a Poisson curve with rate = median count rate of data. |
 |
 |
| Quadrant-wise count rates Data is divided into 100 sec bins |
 |
|
| Module-wise count rates for Quadrant A Data is divided into 100 sec bins |
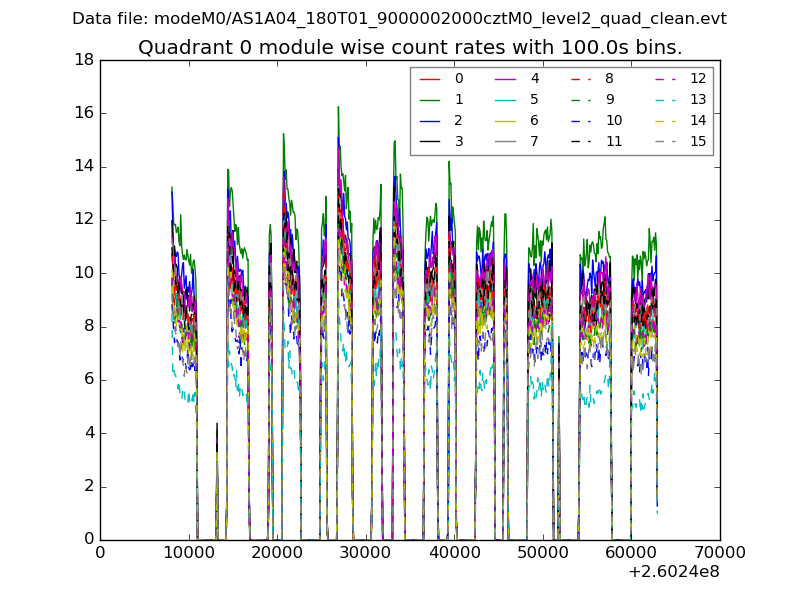 |
 |
| Module-wise count rates for Quadrant B Data is divided into 100 sec bins |
 |
 |
| Module-wise count rates for Quadrant C Data is divided into 100 sec bins |
 |
 |
| Module-wise count rates for Quadrant D Data is divided into 100 sec bins |
 |
 |
| Parameter | Plot |
|---|---|
| CZT HV Monitor |  |
| D_VDD |  |
| Temperature 1 | 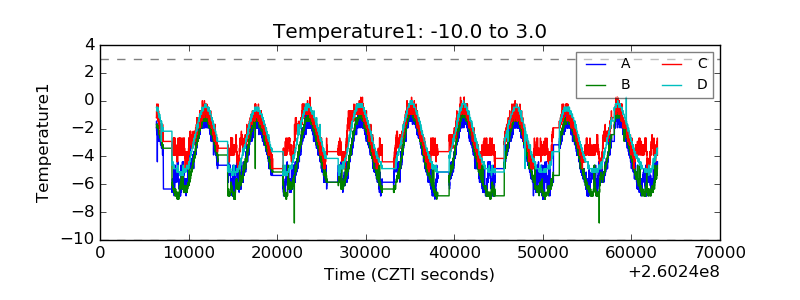 |
| Veto HV Monitor |  |
| Veto LLD |  |
| Alpha Counter |  |
| _CPM_Rate |  |
| CZT Counter | 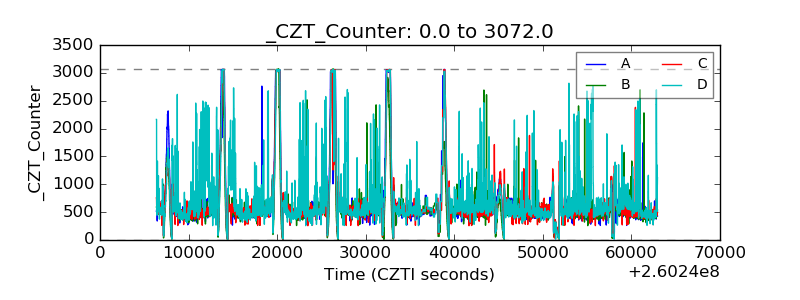 |
| +2.5 Volts monitor |  |
| +5 Volts monitor |  |
| _ROLL_ROT |  |
| _Roll_DEC |  |
| _Roll_RA |  |
| Veto Counter |  |