| Param | Original file | Final file |
|---|---|---|
| Filename | modeM0/AS1G08_032T01_9000001998cztM0_level2_bc.evt | modeM0/AS1G08_032T01_9000001998cztM0_level2_quad_clean.evt |
| Size (bytes) | 757,324,800 | 322,344,000 |
| Size | 722.2 MB | 307.4 MB |
| Events in quadrant A | 4,333,267 | 2,031,188 |
| Events in quadrant B | 4,750,388 | 2,010,458 |
| Events in quadrant C | 4,898,609 | 2,163,685 |
| Events in quadrant D | 7,447,791 | 2,044,274 |
| Mode M9 | |||
|---|---|---|---|
| Quadrant | BADHDUFLAG | Total packets | Discarded packets |
| A | 0 | 23 | 0 |
| B | 0 | 23 | 0 |
| C | 0 | 23 | 0 |
| D | 0 | 23 | 0 |
| Mode M0 | |||
|---|---|---|---|
| Quadrant | BADHDUFLAG | Total packets | Discarded packets |
| A | 0 | 45153 | 0 |
| B | 0 | 46571 | 0 |
| C | 0 | 45126 | 0 |
| D | 0 | 55664 | 0 |
| Mode SS | |||
|---|---|---|---|
| Quadrant | BADHDUFLAG | Total packets | Discarded packets |
| A | 0 | 454 | 0 |
| B | 0 | 450 | 0 |
| C | 0 | 448 | 0 |
| D | 0 | 446 | 0 |
| Quadrant | Total seconds | Saturated seconds | Saturation percentage |
|---|---|---|---|
| A | 22012 | 146 | 0.663275% |
| B | 22012 | 242 | 1.099400% |
| C | 21982 | 125 | 0.568647% |
| D | 21966 | 881 | 4.010744% |
Noise dominated data is calculated using 1-second bins in cleaned event files. If a bin has >2000 counts, and if more than 50% of those come from <1% of pixels, then it is considered to be noise-dominated and hence unusable.
| Quadrant | # 1 sec bins | Bins with >0 counts | Bins with >2000 counts | High rate bins dominated by noise | Noise dominated (total time) | Noise dominated (detector-on time) | Marked lightcurve |
|---|---|---|---|---|---|---|---|
| A | 26150 | 22331 | 0 | 0 | 0.00% | 0.00% |  |
| B | 26150 | 22318 | 8 | 8 | 0.03% | 0.04% |  |
| C | 26150 | 22286 | 1 | 1 | 0.00% | 0.00% |  |
| D | 26150 | 22287 | 83 | 83 | 0.32% | 0.37% |  |
Top three noisy pixels from each quadrant. If the there are fewer than three noisy pixels in the level2.evt file, extra rows are filled as -1
| Pixel properties | Quadrant properties | ||||||
|---|---|---|---|---|---|---|---|
| Quadrant | DetID | PixID | Counts | Sigma | Mean | Median | Sigma |
| A | 14 | 238 | 73181 | 295.71 | 1093 | 1070 | 243.9 |
| A | 1 | 162 | 27644 | 108.97 | 1093 | 1070 | 243.9 |
| A | 10 | 229 | 14466 | 54.93 | 1093 | 1070 | 243.9 |
| B | 3 | 64 | 174550 | 822.44 | 1084 | 1053 | 211.0 |
| B | 3 | 209 | 123353 | 579.75 | 1084 | 1053 | 211.0 |
| B | 4 | 142 | 80223 | 375.3 | 1084 | 1053 | 211.0 |
| C | 3 | 233 | 490717 | 1902.92 | 1113 | 1093 | 257.3 |
| C | 7 | 238 | 28835 | 107.82 | 1113 | 1093 | 257.3 |
| C | 8 | 222 | 12441 | 44.1 | 1113 | 1093 | 257.3 |
| D | 13 | 122 | 1353929 | 5061.99 | 1101 | 1058 | 267.3 |
| D | 5 | 222 | 667611 | 2494.02 | 1101 | 1058 | 267.3 |
| D | 8 | 195 | 451082 | 1683.84 | 1101 | 1058 | 267.3 |
Histogram calculated using DETX and DETY for each event in the final _common_clean file
| Quadrant A | 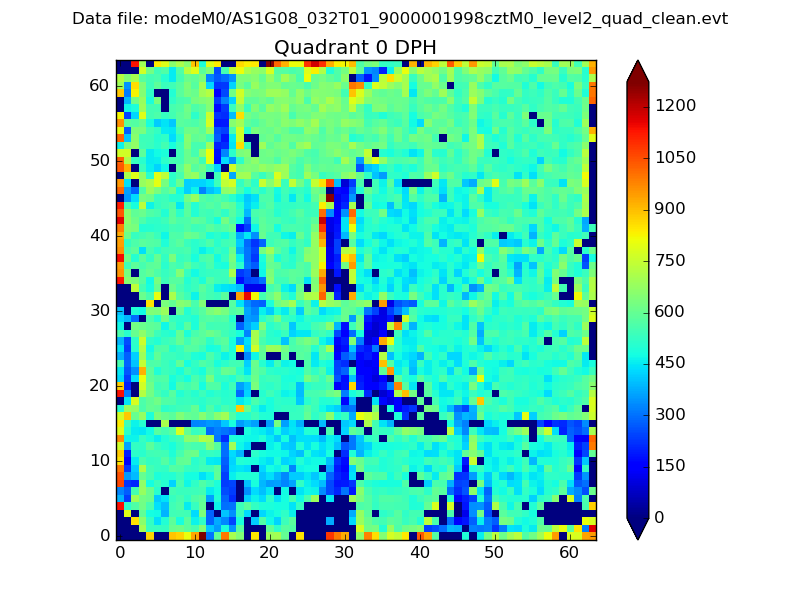 |
 |
Quadrant B |
|---|---|---|---|
| Quadrant D | 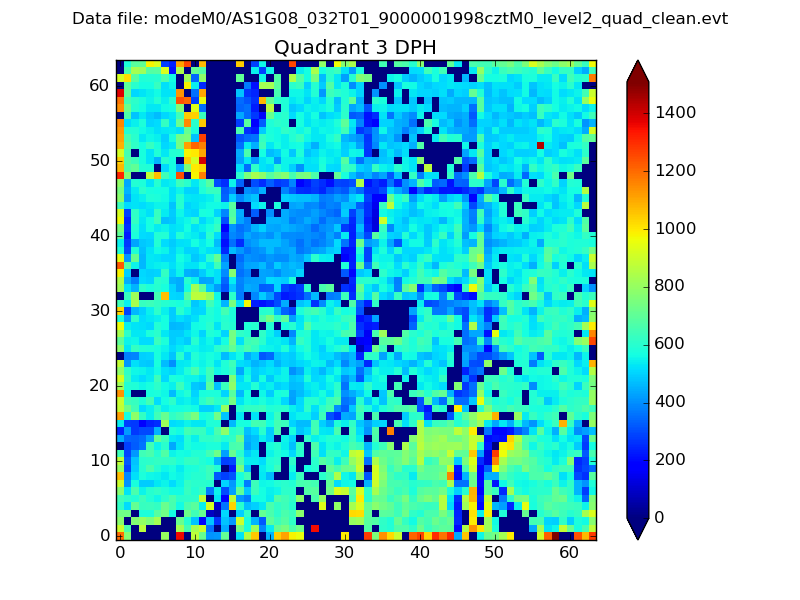 |
 |
Quadrant C |
| Plot type | Count rate plots | Images |
|---|---|---|
| Comparison with Poisson distribution Blue bars denote a histogram of data divided into 1 sec bins. Red curve is a Poisson curve with rate = median count rate of data. |
 |
 |
| Quadrant-wise count rates Data is divided into 100 sec bins |
 |
|
| Module-wise count rates for Quadrant A Data is divided into 100 sec bins |
 |
 |
| Module-wise count rates for Quadrant B Data is divided into 100 sec bins |
 |
 |
| Module-wise count rates for Quadrant C Data is divided into 100 sec bins |
 |
 |
| Module-wise count rates for Quadrant D Data is divided into 100 sec bins |
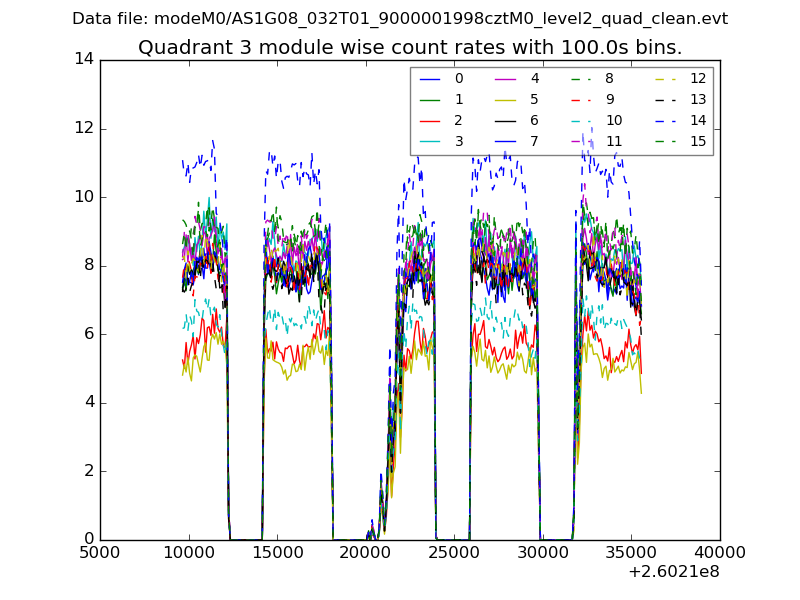 |
 |
| Parameter | Plot |
|---|---|
| CZT HV Monitor |  |
| D_VDD |  |
| Temperature 1 |  |
| Veto HV Monitor |  |
| Veto LLD |  |
| Alpha Counter | 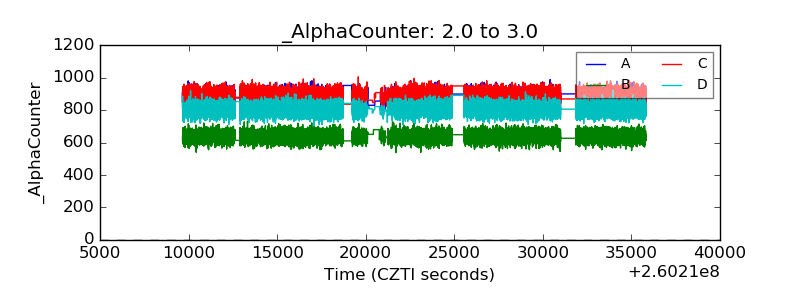 |
| _CPM_Rate |  |
| CZT Counter |  |
| +2.5 Volts monitor | 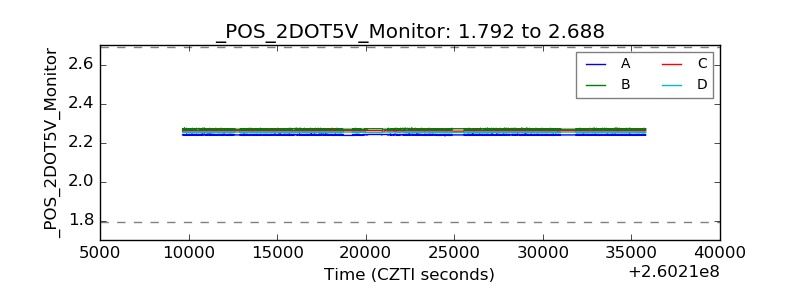 |
| +5 Volts monitor |  |
| _ROLL_ROT |  |
| _Roll_DEC |  |
| _Roll_RA |  |
| Veto Counter | 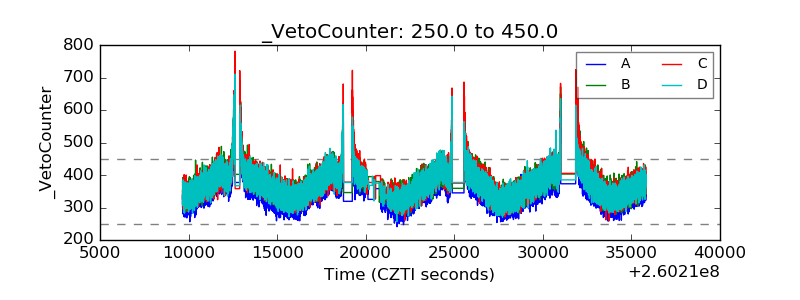 |