| Param | Original file | Final file |
|---|---|---|
| Filename | modeM0/AS1T02_038T01_9000001994cztM0_level2_bc.evt | modeM0/AS1T02_038T01_9000001994cztM0_level2_quad_clean.evt |
| Size (bytes) | 3,619,094,400 | 1,449,970,560 |
| Size | 3.4 GB | 1.4 GB |
| Events in quadrant A | 22,722,203 | 9,796,151 |
| Events in quadrant B | 24,924,027 | 9,728,845 |
| Events in quadrant C | 25,530,074 | 9,704,401 |
| Events in quadrant D | 30,677,837 | 8,898,843 |
| Mode M9 | |||
|---|---|---|---|
| Quadrant | BADHDUFLAG | Total packets | Discarded packets |
| A | 0 | 143 | 0 |
| B | 0 | 143 | 0 |
| C | 0 | 143 | 0 |
| D | 0 | 143 | 0 |
| Mode SS | |||
|---|---|---|---|
| Quadrant | BADHDUFLAG | Total packets | Discarded packets |
| A | 0 | 1720 | 0 |
| B | 0 | 1720 | 0 |
| C | 0 | 1720 | 0 |
| D | 0 | 1720 | 0 |
| Mode M0 | |||
|---|---|---|---|
| Quadrant | BADHDUFLAG | Total packets | Discarded packets |
| A | 0 | 188778 | 0 |
| B | 0 | 199018 | 0 |
| C | 0 | 198322 | 0 |
| D | 0 | 221476 | 0 |
| Quadrant | Total seconds | Saturated seconds | Saturation percentage |
|---|---|---|---|
| A | 84537 | 1312 | 1.551983% |
| B | 84537 | 2516 | 2.976212% |
| C | 84537 | 940 | 1.111939% |
| D | 84537 | 3906 | 4.620462% |
Noise dominated data is calculated using 1-second bins in cleaned event files. If a bin has >2000 counts, and if more than 50% of those come from <1% of pixels, then it is considered to be noise-dominated and hence unusable.
| Quadrant | # 1 sec bins | Bins with >0 counts | Bins with >2000 counts | High rate bins dominated by noise | Noise dominated (total time) | Noise dominated (detector-on time) | Marked lightcurve |
|---|---|---|---|---|---|---|---|
| A | 97738 | 84530 | 10 | 10 | 0.01% | 0.01% |  |
| B | 97739 | 84529 | 140 | 140 | 0.14% | 0.17% |  |
| C | 97739 | 84529 | 3 | 3 | 0.00% | 0.00% |  |
| D | 97738 | 84529 | 200 | 200 | 0.20% | 0.24% | 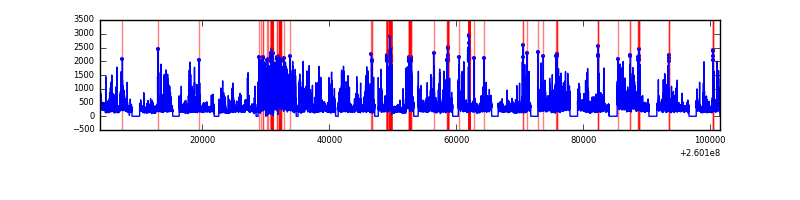 |
Top three noisy pixels from each quadrant. If the there are fewer than three noisy pixels in the level2.evt file, extra rows are filled as -1
| Pixel properties | Quadrant properties | ||||||
|---|---|---|---|---|---|---|---|
| Quadrant | DetID | PixID | Counts | Sigma | Mean | Median | Sigma |
| A | 14 | 238 | 1057589 | 699.65 | 5504 | 5132 | 1504.3 |
| A | 15 | 69 | 180919 | 116.86 | 5504 | 5132 | 1504.3 |
| A | 1 | 162 | 173036 | 111.62 | 5504 | 5132 | 1504.3 |
| B | 3 | 64 | 1462094 | 1151.68 | 5477 | 5347 | 1264.9 |
| B | 0 | 182 | 586163 | 459.18 | 5477 | 5347 | 1264.9 |
| B | 5 | 32 | 398636 | 310.93 | 5477 | 5347 | 1264.9 |
| C | 3 | 233 | 4416101 | 3188.36 | 5377 | 5325 | 1383.4 |
| C | 12 | 4 | 70439 | 47.07 | 5377 | 5325 | 1383.4 |
| C | 14 | 234 | 36388 | 22.45 | 5377 | 5325 | 1383.4 |
| D | 13 | 122 | 4596107 | 3215.17 | 5248 | 4917 | 1428.0 |
| D | 5 | 222 | 1784152 | 1245.98 | 5248 | 4917 | 1428.0 |
| D | 8 | 195 | 1742009 | 1216.47 | 5248 | 4917 | 1428.0 |
Histogram calculated using DETX and DETY for each event in the final _common_clean file
| Quadrant A | 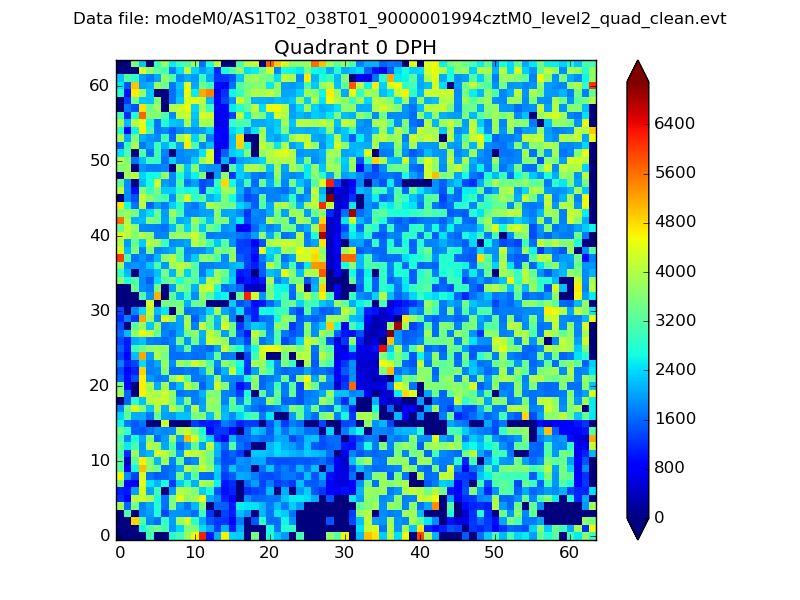 |
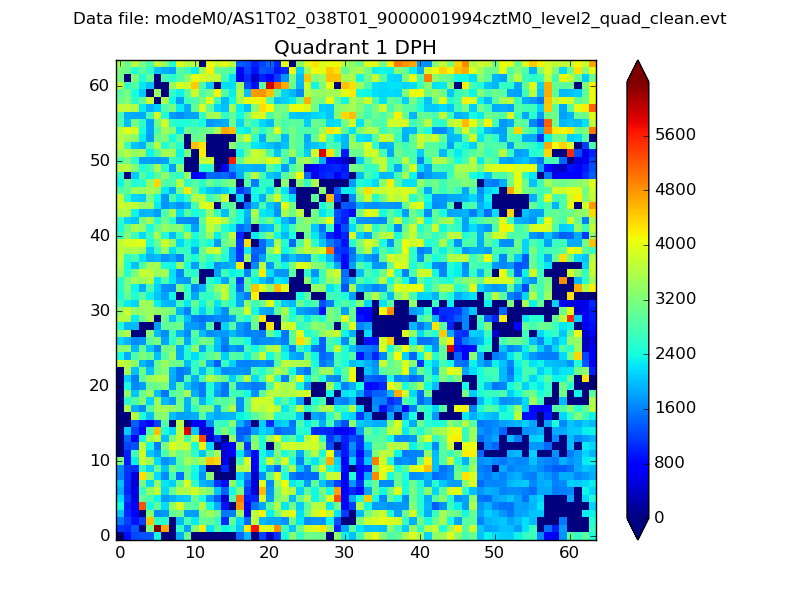 |
Quadrant B |
|---|---|---|---|
| Quadrant D |  |
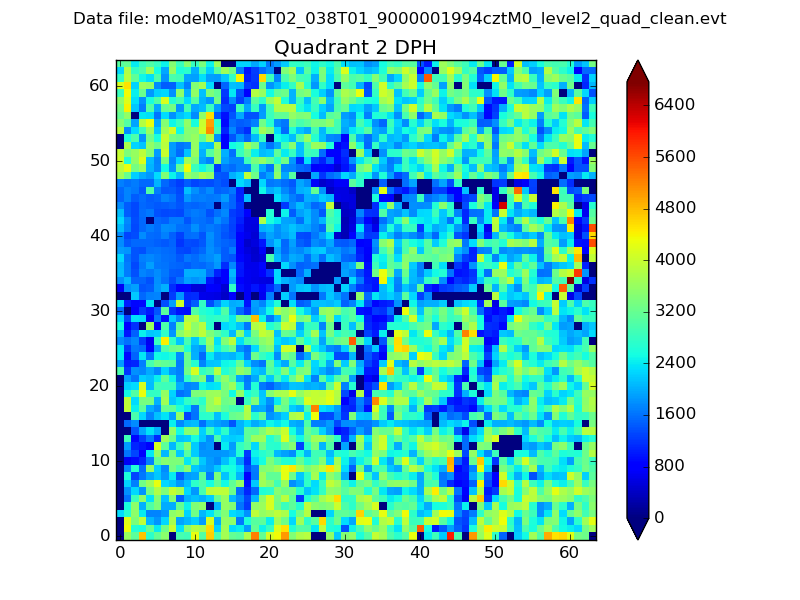 |
Quadrant C |
| Plot type | Count rate plots | Images |
|---|---|---|
| Comparison with Poisson distribution Blue bars denote a histogram of data divided into 1 sec bins. Red curve is a Poisson curve with rate = median count rate of data. |
 |
 |
| Quadrant-wise count rates Data is divided into 100 sec bins |
 |
|
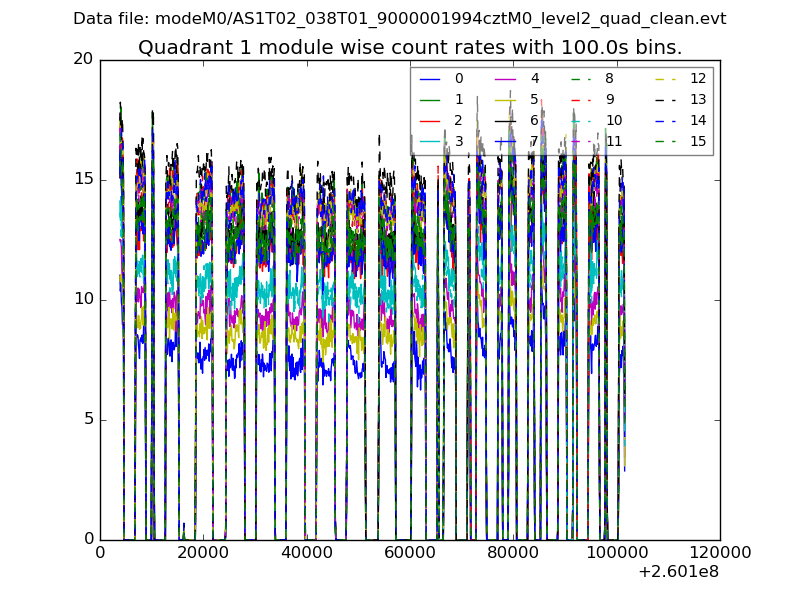
| Module-wise count rates for Quadrant A Data is divided into 100 sec bins |
 |
 |
| Module-wise count rates for Quadrant B Data is divided into 100 sec bins |
 |
 |
| Module-wise count rates for Quadrant C Data is divided into 100 sec bins |
 |
 |
| Module-wise count rates for Quadrant D Data is divided into 100 sec bins |
 |
 |
| Parameter | Plot |
|---|---|
| CZT HV Monitor | 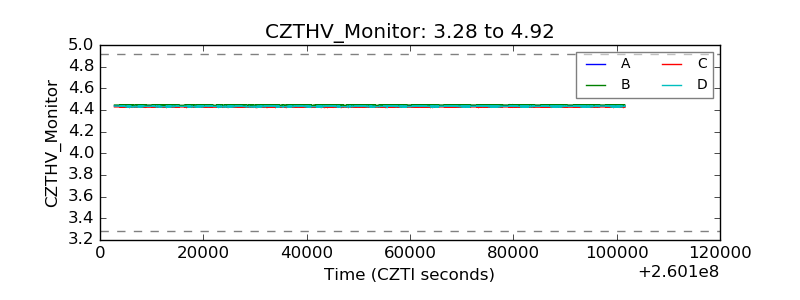 |
| D_VDD |  |
| Temperature 1 |  |
| Veto HV Monitor | 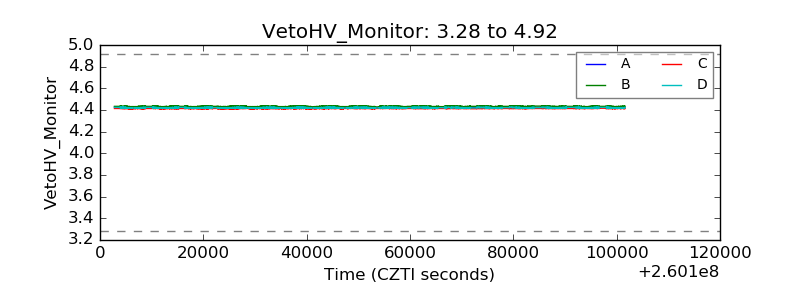 |
| Veto LLD |  |
| Alpha Counter | 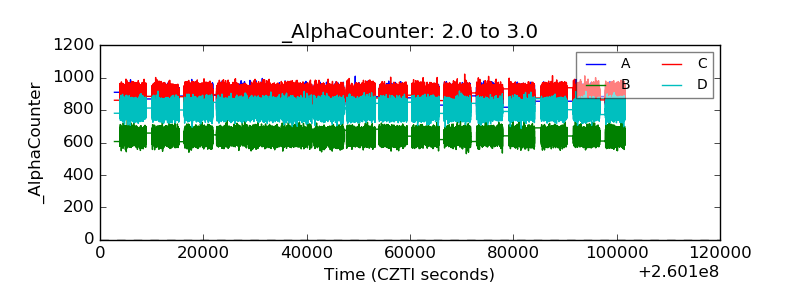 |
| _CPM_Rate |  |
| CZT Counter | 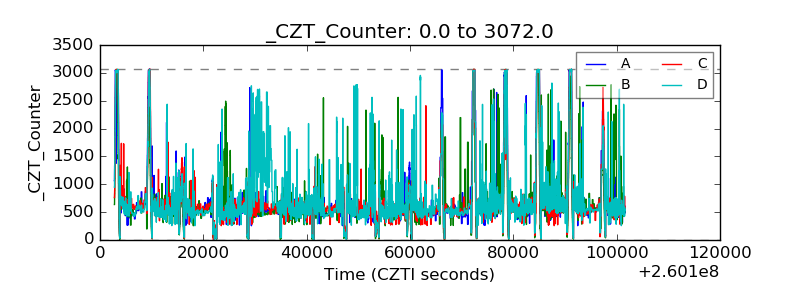 |
| +2.5 Volts monitor |  |
| +5 Volts monitor |  |
| _ROLL_ROT |  |
| _Roll_DEC |  |
| _Roll_RA |  |
| Veto Counter |  |