| Param | Original file | Final file |
|---|---|---|
| Filename | modeM0/AS1T02_014T01_9000001980cztM0_level2_bc.evt | modeM0/AS1T02_014T01_9000001980cztM0_level2_quad_clean.evt |
| Size (bytes) | 448,778,880 | 184,982,400 |
| Size | 428.0 MB | 176.4 MB |
| Events in quadrant A | 3,302,184 | 1,213,889 |
| Events in quadrant B | 3,129,127 | 1,239,652 |
| Events in quadrant C | 2,906,416 | 1,195,760 |
| Events in quadrant D | 3,441,079 | 1,135,671 |
| Mode M0 | |||
|---|---|---|---|
| Quadrant | BADHDUFLAG | Total packets | Discarded packets |
| A | 0 | 27232 | 0 |
| B | 0 | 26599 | 0 |
| C | 0 | 25637 | 0 |
| D | 0 | 27173 | 0 |
| Mode SS | |||
|---|---|---|---|
| Quadrant | BADHDUFLAG | Total packets | Discarded packets |
| A | 0 | 242 | 0 |
| B | 0 | 242 | 0 |
| C | 0 | 242 | 0 |
| D | 0 | 242 | 0 |
| Mode M9 | |||
|---|---|---|---|
| Quadrant | BADHDUFLAG | Total packets | Discarded packets |
| A | 0 | 35 | 0 |
| B | 0 | 35 | 0 |
| C | 0 | 35 | 0 |
| D | 0 | 35 | 0 |
| Quadrant | Total seconds | Saturated seconds | Saturation percentage |
|---|---|---|---|
| A | 11824 | 106 | 0.896482% |
| B | 11824 | 124 | 1.048714% |
| C | 11824 | 103 | 0.871110% |
| D | 11824 | 104 | 0.879567% |
Noise dominated data is calculated using 1-second bins in cleaned event files. If a bin has >2000 counts, and if more than 50% of those come from <1% of pixels, then it is considered to be noise-dominated and hence unusable.
| Quadrant | # 1 sec bins | Bins with >0 counts | Bins with >2000 counts | High rate bins dominated by noise | Noise dominated (total time) | Noise dominated (detector-on time) | Marked lightcurve |
|---|---|---|---|---|---|---|---|
| A | 14374 | 11825 | 3 | 3 | 0.02% | 0.03% |  |
| B | 14374 | 11824 | 4 | 4 | 0.03% | 0.03% |  |
| C | 14374 | 11824 | 8 | 8 | 0.06% | 0.07% | 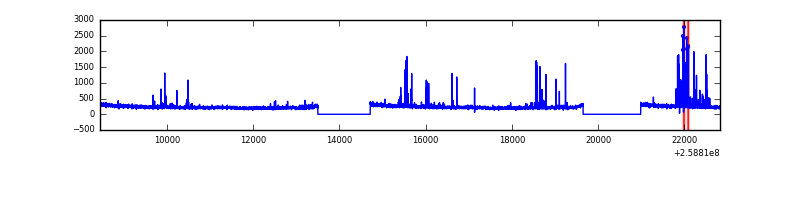 |
| D | 14374 | 11824 | 6 | 6 | 0.04% | 0.05% | 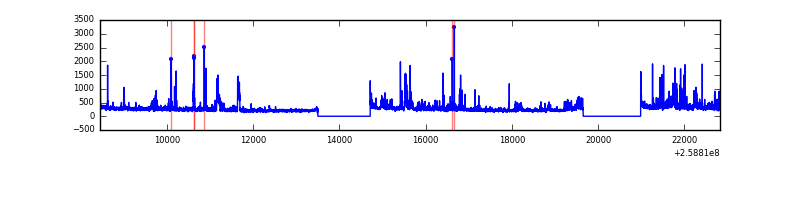 |
Top three noisy pixels from each quadrant. If the there are fewer than three noisy pixels in the level2.evt file, extra rows are filled as -1
| Pixel properties | Quadrant properties | ||||||
|---|---|---|---|---|---|---|---|
| Quadrant | DetID | PixID | Counts | Sigma | Mean | Median | Sigma |
| A | 8 | 15 | 532593 | 3422.99 | 699 | 687 | 155.4 |
| A | 1 | 162 | 35590 | 224.61 | 699 | 687 | 155.4 |
| A | 9 | 143 | 22856 | 142.66 | 699 | 687 | 155.4 |
| B | 0 | 189 | 75508 | 546.84 | 710 | 697 | 136.8 |
| B | 3 | 64 | 57793 | 417.35 | 710 | 697 | 136.8 |
| B | 3 | 209 | 53863 | 388.62 | 710 | 697 | 136.8 |
| C | 15 | 208 | 226699 | 1469.38 | 680 | 677 | 153.8 |
| C | 8 | 128 | 8823 | 52.96 | 680 | 677 | 153.8 |
| C | 8 | 112 | 5386 | 30.61 | 680 | 677 | 153.8 |
| D | 8 | 195 | 336584 | 2095.08 | 681 | 657 | 160.3 |
| D | 2 | 136 | 121407 | 753.08 | 681 | 657 | 160.3 |
| D | 5 | 222 | 113088 | 701.2 | 681 | 657 | 160.3 |
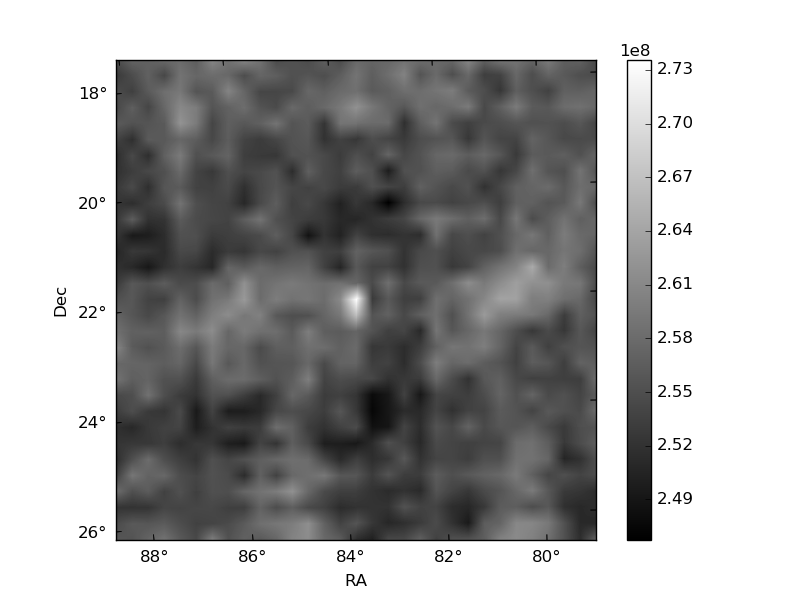
Histogram calculated using DETX and DETY for each event in the final _common_clean file
| Quadrant A |  |
 |
Quadrant B |
|---|---|---|---|
| Quadrant D | 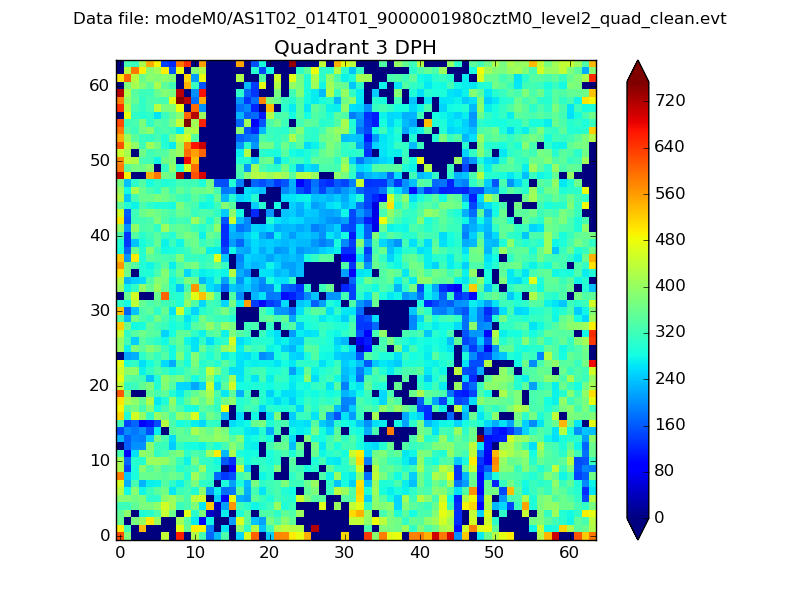 |
 |
Quadrant C |
| Plot type | Count rate plots | Images |
|---|---|---|
| Comparison with Poisson distribution Blue bars denote a histogram of data divided into 1 sec bins. Red curve is a Poisson curve with rate = median count rate of data. |
 |
 |
| Quadrant-wise count rates Data is divided into 100 sec bins |
 |
|
| Module-wise count rates for Quadrant A Data is divided into 100 sec bins |
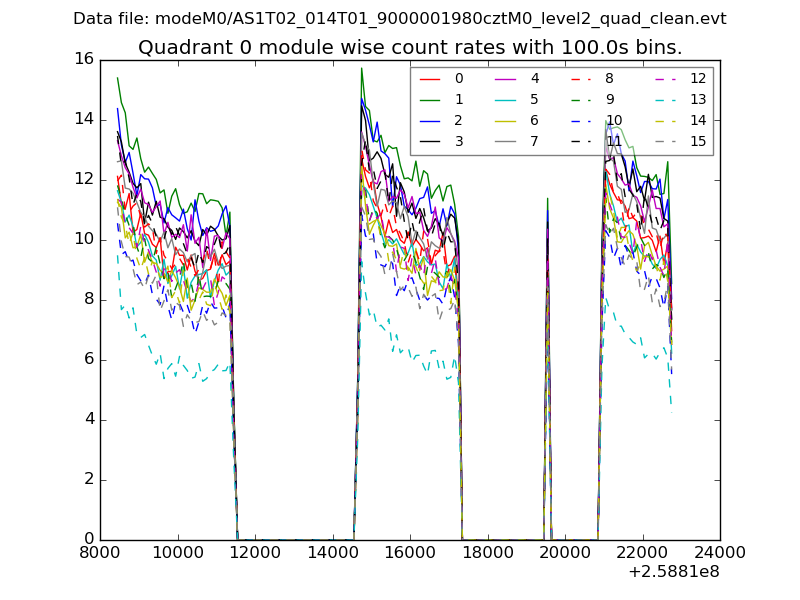 |
 |
| Module-wise count rates for Quadrant B Data is divided into 100 sec bins |
 |
 |
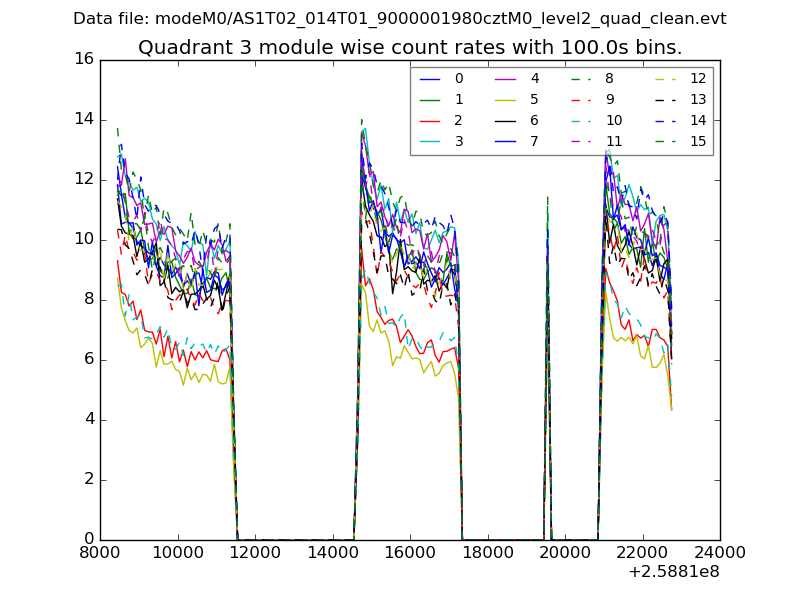
| Module-wise count rates for Quadrant C Data is divided into 100 sec bins |
 |
 |
| Module-wise count rates for Quadrant D Data is divided into 100 sec bins |
 |
 |
| Parameter | Plot |
|---|---|
| CZT HV Monitor |  |
| D_VDD | 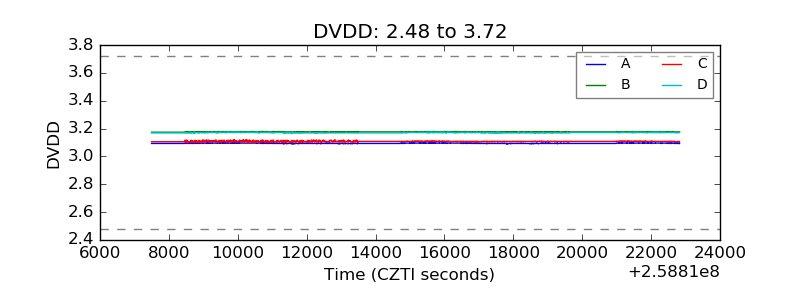 |
| Temperature 1 |  |
| Veto HV Monitor |  |
| Veto LLD |  |
| Alpha Counter | 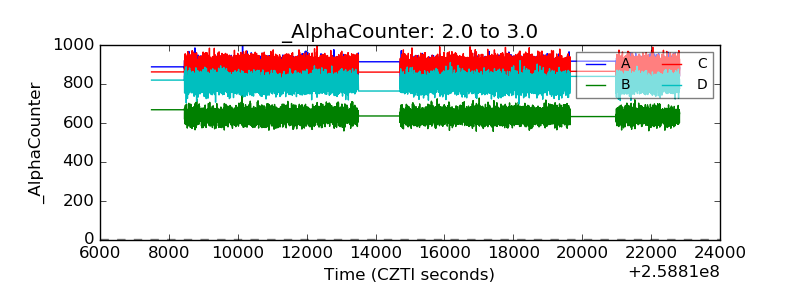 |
| _CPM_Rate |  |
| CZT Counter | 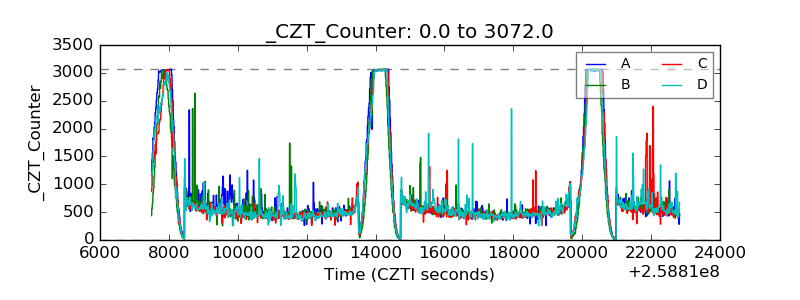 |
| +2.5 Volts monitor |  |
| +5 Volts monitor |  |
| _ROLL_ROT |  |
| _Roll_DEC |  |
| _Roll_RA | 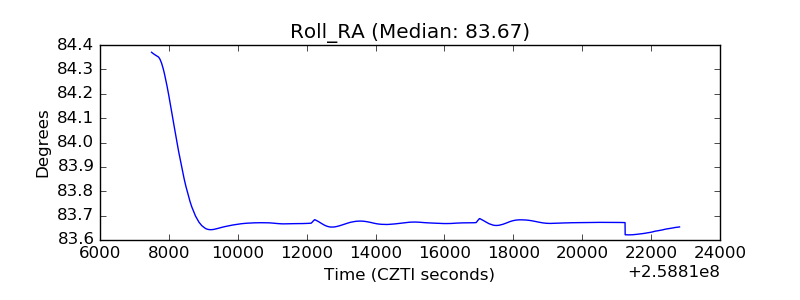 |
| Veto Counter |  |