| Param | Original file | Final file |
|---|---|---|
| Filename | modeM0/AS1A04_196T04_9000001982cztM0_level2_bc.evt | modeM0/AS1A04_196T04_9000001982cztM0_level2_quad_clean.evt |
| Size (bytes) | 189,423,360 | 96,203,520 |
| Size | 180.6 MB | 91.7 MB |
| Events in quadrant A | 1,427,927 | 624,830 |
| Events in quadrant B | 1,301,854 | 648,132 |
| Events in quadrant C | 1,243,124 | 648,628 |
| Events in quadrant D | 1,384,748 | 610,708 |
| Mode SS | |||
|---|---|---|---|
| Quadrant | BADHDUFLAG | Total packets | Discarded packets |
| A | 0 | 112 | 0 |
| B | 0 | 112 | 0 |
| C | 0 | 112 | 0 |
| D | 0 | 112 | 0 |
| Mode M0 | |||
|---|---|---|---|
| Quadrant | BADHDUFLAG | Total packets | Discarded packets |
| A | 0 | 12138 | 0 |
| B | 0 | 11840 | 0 |
| C | 0 | 11523 | 0 |
| D | 0 | 12045 | 0 |
| Mode M9 | |||
|---|---|---|---|
| Quadrant | BADHDUFLAG | Total packets | Discarded packets |
| A | 0 | 14 | 0 |
| B | 0 | 14 | 0 |
| C | 0 | 14 | 0 |
| D | 0 | 14 | 0 |
| Quadrant | Total seconds | Saturated seconds | Saturation percentage |
|---|---|---|---|
| A | 5445 | 25 | 0.459137% |
| B | 5445 | 27 | 0.495868% |
| C | 5445 | 14 | 0.257117% |
| D | 5445 | 35 | 0.642792% |
Noise dominated data is calculated using 1-second bins in cleaned event files. If a bin has >2000 counts, and if more than 50% of those come from <1% of pixels, then it is considered to be noise-dominated and hence unusable.
| Quadrant | # 1 sec bins | Bins with >0 counts | Bins with >2000 counts | High rate bins dominated by noise | Noise dominated (total time) | Noise dominated (detector-on time) | Marked lightcurve |
|---|---|---|---|---|---|---|---|
| A | 6861 | 5446 | 0 | 0 | 0.00% | 0.00% |  |
| B | 6861 | 5446 | 0 | 0 | 0.00% | 0.00% |  |
| C | 6861 | 5446 | 0 | 0 | 0.00% | 0.00% |  |
| D | 6861 | 5446 | 0 | 0 | 0.00% | 0.00% |  |
Top three noisy pixels from each quadrant. If the there are fewer than three noisy pixels in the level2.evt file, extra rows are filled as -1
| Pixel properties | Quadrant properties | ||||||
|---|---|---|---|---|---|---|---|
| Quadrant | DetID | PixID | Counts | Sigma | Mean | Median | Sigma |
| A | 8 | 15 | 254092 | 3835.74 | 301 | 295 | 66.2 |
| A | 1 | 162 | 8161 | 118.88 | 301 | 295 | 66.2 |
| A | 15 | 69 | 5423 | 77.5 | 301 | 295 | 66.2 |
| B | 0 | 244 | 83012 | 1394.51 | 308 | 301 | 59.3 |
| B | 0 | 214 | 12286 | 202.07 | 308 | 301 | 59.3 |
| B | 3 | 64 | 11253 | 184.65 | 308 | 301 | 59.3 |
| C | 6 | 96 | 34268 | 496.75 | 304 | 301 | 68.4 |
| C | 14 | 234 | 13458 | 192.42 | 304 | 301 | 68.4 |
| C | 3 | 233 | 3234 | 42.89 | 304 | 301 | 68.4 |
| D | 1 | 52 | 115842 | 1655.07 | 300 | 291 | 69.8 |
| D | 8 | 195 | 54747 | 779.99 | 300 | 291 | 69.8 |
| D | 14 | 35 | 24840 | 351.62 | 300 | 291 | 69.8 |
Histogram calculated using DETX and DETY for each event in the final _common_clean file
| Quadrant A |  |
 |
Quadrant B |
|---|---|---|---|
| Quadrant D | 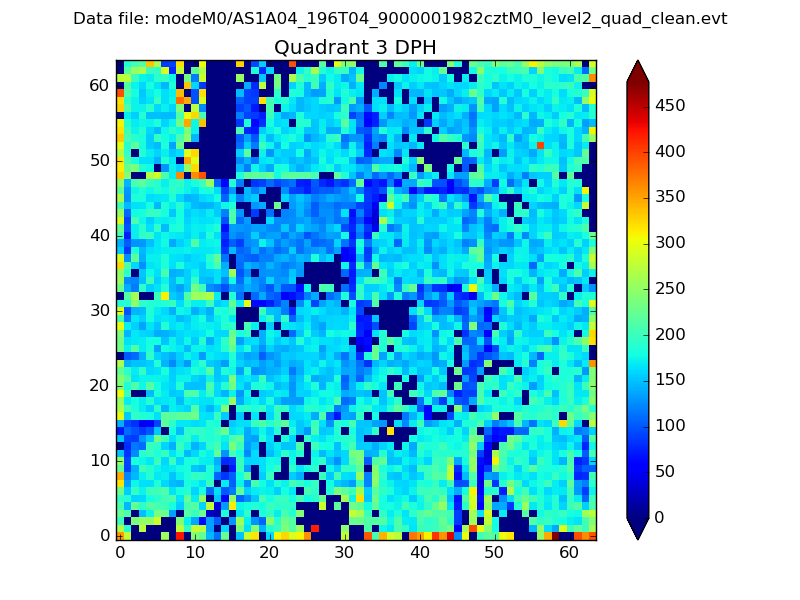 |
 |
Quadrant C |
| Plot type | Count rate plots | Images |
|---|---|---|
| Comparison with Poisson distribution Blue bars denote a histogram of data divided into 1 sec bins. Red curve is a Poisson curve with rate = median count rate of data. |
 |
 |
| Quadrant-wise count rates Data is divided into 100 sec bins |
 |
|
| Module-wise count rates for Quadrant A Data is divided into 100 sec bins |
 |
 |
| Module-wise count rates for Quadrant B Data is divided into 100 sec bins |
 |
 |
| Module-wise count rates for Quadrant C Data is divided into 100 sec bins |
 |
 |
| Module-wise count rates for Quadrant D Data is divided into 100 sec bins |
 |
 |
| Parameter | Plot |
|---|---|
| CZT HV Monitor |  |
| D_VDD |  |
| Temperature 1 |  |
| Veto HV Monitor |  |
| Veto LLD |  |
| Alpha Counter | 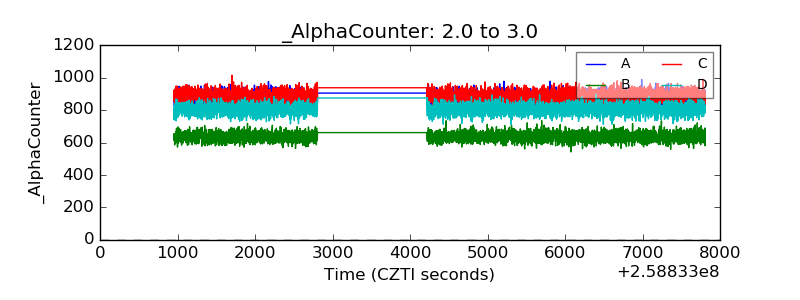 |
| _CPM_Rate |  |
| CZT Counter |  |
| +2.5 Volts monitor |  |
| +5 Volts monitor |  |
| _ROLL_ROT |  |
| _Roll_DEC |  |
| _Roll_RA |  |
| Veto Counter |  |