| Param | Original file | Final file |
|---|---|---|
| Filename | modeM0/AS1G08_023T01_9000001978cztM0_level2_bc.evt | modeM0/AS1G08_023T01_9000001978cztM0_level2_quad_clean.evt |
| Size (bytes) | 2,792,116,800 | 1,130,402,880 |
| Size | 2.6 GB | 1.1 GB |
| Events in quadrant A | 19,084,027 | 7,236,894 |
| Events in quadrant B | 19,165,413 | 7,420,053 |
| Events in quadrant C | 16,889,750 | 7,204,633 |
| Events in quadrant D | 23,876,597 | 6,802,826 |
| Mode M0 | |||
|---|---|---|---|
| Quadrant | BADHDUFLAG | Total packets | Discarded packets |
| A | 0 | 176880 | 0 |
| B | 0 | 176679 | 0 |
| C | 0 | 169411 | 0 |
| D | 0 | 193307 | 0 |
| Mode SS | |||
|---|---|---|---|
| Quadrant | BADHDUFLAG | Total packets | Discarded packets |
| A | 0 | 1658 | 0 |
| B | 0 | 1658 | 0 |
| C | 0 | 1658 | 0 |
| D | 0 | 1658 | 0 |
| Mode M9 | |||
|---|---|---|---|
| Quadrant | BADHDUFLAG | Total packets | Discarded packets |
| A | 0 | 126 | 0 |
| B | 0 | 126 | 0 |
| C | 0 | 126 | 0 |
| D | 0 | 126 | 0 |
| Quadrant | Total seconds | Saturated seconds | Saturation percentage |
|---|---|---|---|
| A | 81327 | 1484 | 1.824732% |
| B | 81327 | 1560 | 1.918182% |
| C | 81327 | 839 | 1.031638% |
| D | 81327 | 2536 | 3.118276% |
Noise dominated data is calculated using 1-second bins in cleaned event files. If a bin has >2000 counts, and if more than 50% of those come from <1% of pixels, then it is considered to be noise-dominated and hence unusable.
| Quadrant | # 1 sec bins | Bins with >0 counts | Bins with >2000 counts | High rate bins dominated by noise | Noise dominated (total time) | Noise dominated (detector-on time) | Marked lightcurve |
|---|---|---|---|---|---|---|---|
| A | 94018 | 81332 | 120 | 120 | 0.13% | 0.15% |  |
| B | 94018 | 81331 | 50 | 50 | 0.05% | 0.06% |  |
| C | 94018 | 81330 | 20 | 20 | 0.02% | 0.02% |  |
| D | 94018 | 81329 | 227 | 227 | 0.24% | 0.28% |  |
Top three noisy pixels from each quadrant. If the there are fewer than three noisy pixels in the level2.evt file, extra rows are filled as -1
| Pixel properties | Quadrant properties | ||||||
|---|---|---|---|---|---|---|---|
| Quadrant | DetID | PixID | Counts | Sigma | Mean | Median | Sigma |
| A | 8 | 15 | 2032830 | 2240.63 | 4149 | 4059 | 905.4 |
| A | 9 | 143 | 783817 | 861.19 | 4149 | 4059 | 905.4 |
| A | 1 | 162 | 217080 | 235.27 | 4149 | 4059 | 905.4 |
| B | 3 | 64 | 1600243 | 1997.9 | 4251 | 4147 | 798.9 |
| B | 4 | 142 | 206378 | 253.14 | 4251 | 4147 | 798.9 |
| B | 3 | 209 | 200195 | 245.4 | 4251 | 4147 | 798.9 |
| C | 6 | 96 | 606364 | 665.45 | 4108 | 4059 | 905.1 |
| C | 15 | 208 | 115448 | 123.07 | 4108 | 4059 | 905.1 |
| C | 3 | 233 | 51044 | 51.91 | 4108 | 4059 | 905.1 |
| D | 1 | 52 | 2880840 | 3079.32 | 4053 | 3914 | 934.3 |
| D | 5 | 222 | 2010179 | 2147.41 | 4053 | 3914 | 934.3 |
| D | 8 | 195 | 1028896 | 1097.09 | 4053 | 3914 | 934.3 |
Histogram calculated using DETX and DETY for each event in the final _common_clean file
| Quadrant A |  |
 |
Quadrant B |
|---|---|---|---|
| Quadrant D |  |
 |
Quadrant C |
| Plot type | Count rate plots | Images |
|---|---|---|
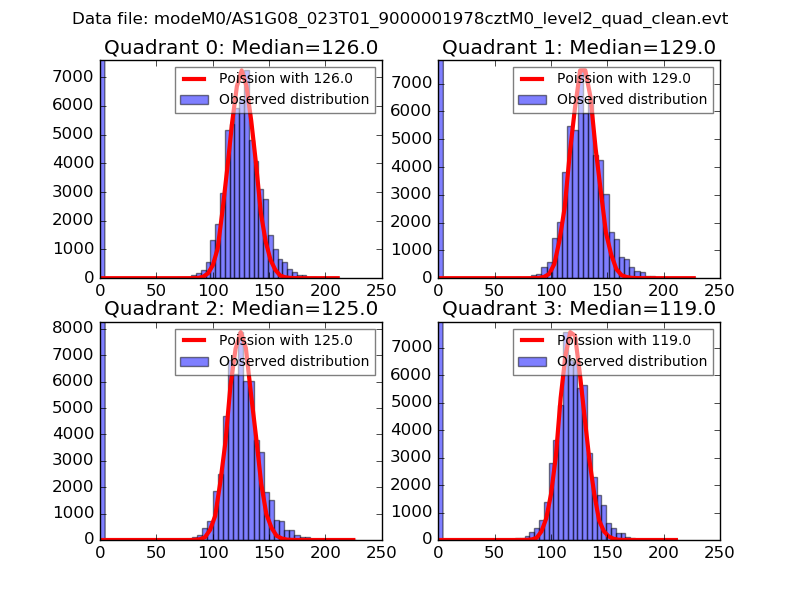
| Comparison with Poisson distribution Blue bars denote a histogram of data divided into 1 sec bins. Red curve is a Poisson curve with rate = median count rate of data. |
 |
 |
| Quadrant-wise count rates Data is divided into 100 sec bins |
 |
|
| Module-wise count rates for Quadrant A Data is divided into 100 sec bins |
 |
 |
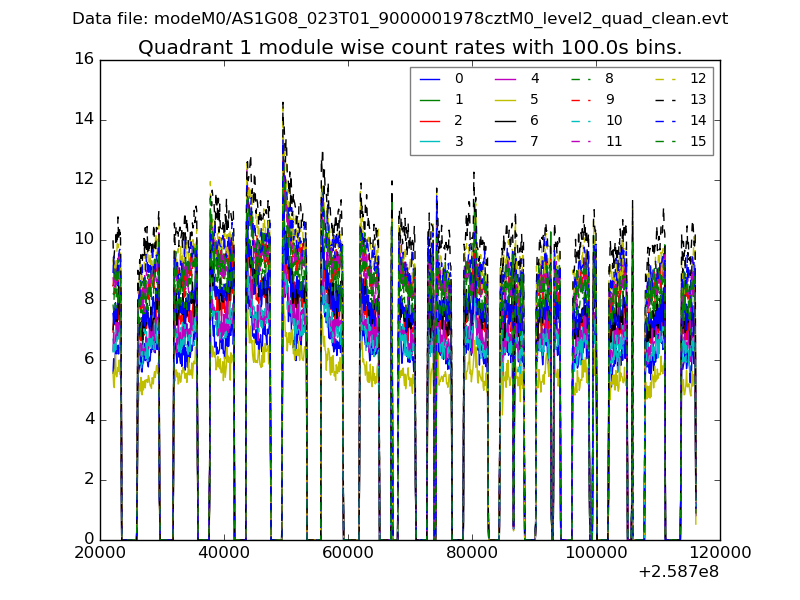
| Module-wise count rates for Quadrant B Data is divided into 100 sec bins |
 |
 |
| Module-wise count rates for Quadrant C Data is divided into 100 sec bins |
 |
 |
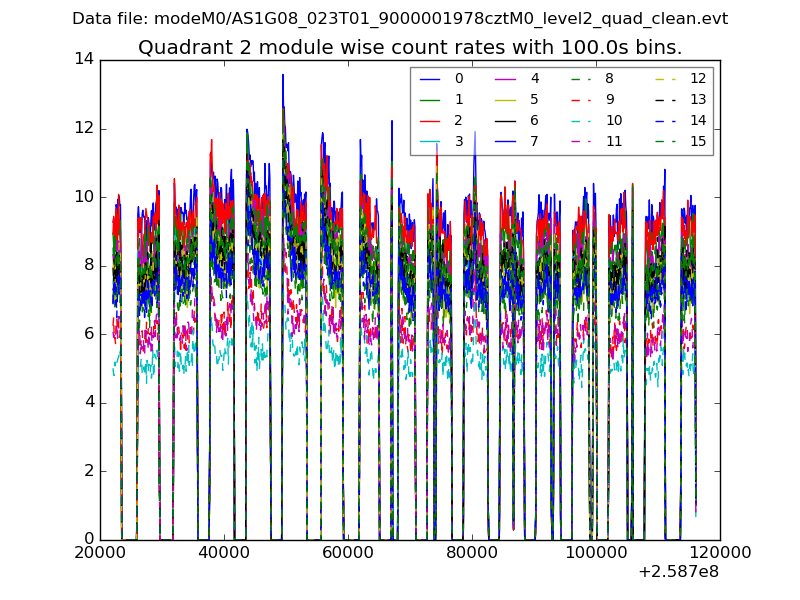
| Module-wise count rates for Quadrant D Data is divided into 100 sec bins |
 |
 |
| Parameter | Plot |
|---|---|
| CZT HV Monitor |  |
| D_VDD | 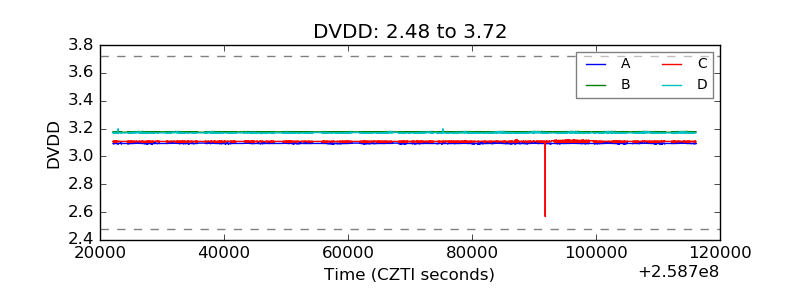 |
| Temperature 1 |  |
| Veto HV Monitor |  |
| Veto LLD |  |
| Alpha Counter |  |
| _CPM_Rate |  |
| CZT Counter | 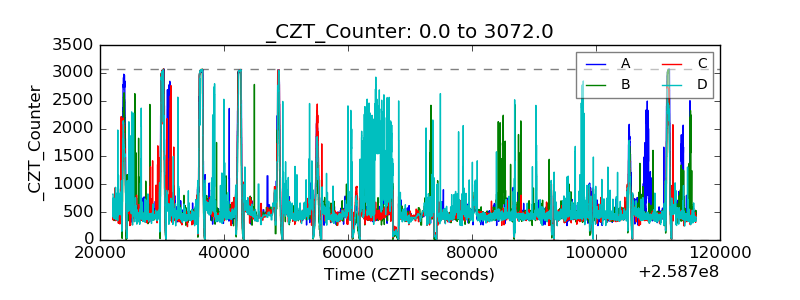 |
| +2.5 Volts monitor |  |
| +5 Volts monitor |  |
| _ROLL_ROT | 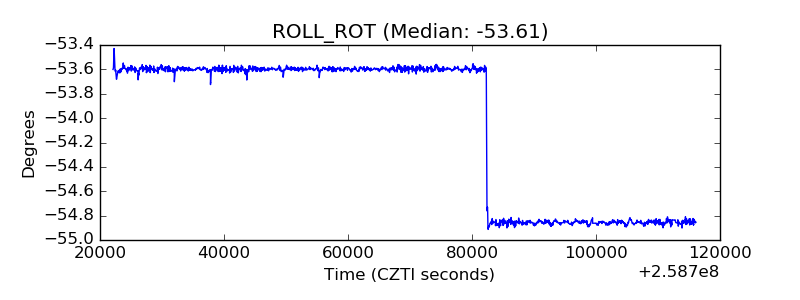 |
| _Roll_DEC | 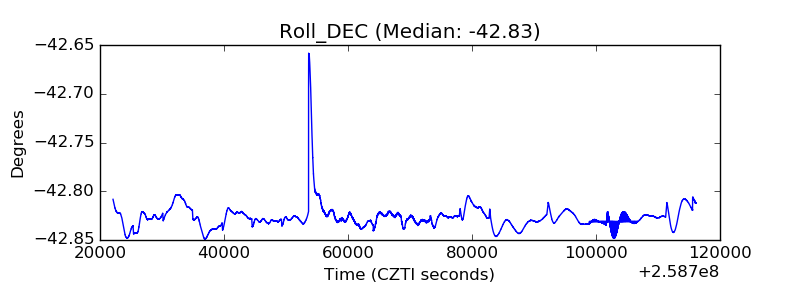 |
| _Roll_RA |  |
| Veto Counter |  |