| Param | Original file | Final file |
|---|---|---|
| Filename | modeM0/AS1G08_031T03_9000001972cztM0_level2_bc.evt | modeM0/AS1G08_031T03_9000001972cztM0_level2_quad_clean.evt |
| Size (bytes) | 1,095,969,600 | 314,441,280 |
| Size | 1.0 GB | 299.9 MB |
| Events in quadrant A | 12,465,965 | 1,956,134 |
| Events in quadrant B | 6,025,455 | 2,045,024 |
| Events in quadrant C | 4,805,238 | 2,017,307 |
| Events in quadrant D | 8,311,705 | 1,910,362 |
| Mode M9 | |||
|---|---|---|---|
| Quadrant | BADHDUFLAG | Total packets | Discarded packets |
| A | 0 | 51 | 0 |
| B | 0 | 51 | 0 |
| C | 0 | 51 | 0 |
| D | 0 | 51 | 0 |
| Mode M0 | |||
|---|---|---|---|
| Quadrant | BADHDUFLAG | Total packets | Discarded packets |
| A | 0 | 80039 | 0 |
| B | 0 | 53243 | 0 |
| C | 0 | 48174 | 0 |
| D | 0 | 60380 | 0 |
| Mode SS | |||
|---|---|---|---|
| Quadrant | BADHDUFLAG | Total packets | Discarded packets |
| A | 0 | 474 | 0 |
| B | 0 | 474 | 0 |
| C | 0 | 474 | 0 |
| D | 0 | 474 | 0 |
| Quadrant | Total seconds | Saturated seconds | Saturation percentage |
|---|---|---|---|
| A | 23169 | 3192 | 13.777030% |
| B | 23169 | 739 | 3.189607% |
| C | 23169 | 199 | 0.858906% |
| D | 23169 | 975 | 4.208209% |
Noise dominated data is calculated using 1-second bins in cleaned event files. If a bin has >2000 counts, and if more than 50% of those come from <1% of pixels, then it is considered to be noise-dominated and hence unusable.
| Quadrant | # 1 sec bins | Bins with >0 counts | Bins with >2000 counts | High rate bins dominated by noise | Noise dominated (total time) | Noise dominated (detector-on time) | Marked lightcurve |
|---|---|---|---|---|---|---|---|
| A | 28295 | 23173 | 219 | 219 | 0.77% | 0.95% |  |
| B | 28295 | 23169 | 72 | 72 | 0.25% | 0.31% | 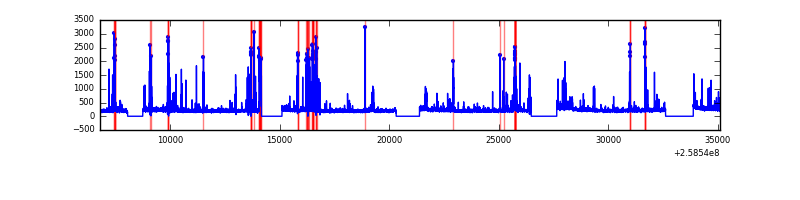 |
| C | 28295 | 23171 | 0 | 0 | 0.00% | 0.00% |  |
| D | 28295 | 23169 | 277 | 277 | 0.98% | 1.20% | 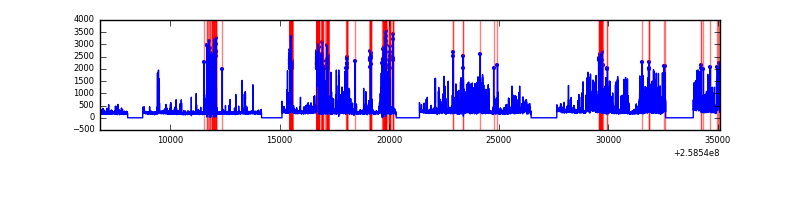 |
Top three noisy pixels from each quadrant. If the there are fewer than three noisy pixels in the level2.evt file, extra rows are filled as -1
| Pixel properties | Quadrant properties | ||||||
|---|---|---|---|---|---|---|---|
| Quadrant | DetID | PixID | Counts | Sigma | Mean | Median | Sigma |
| A | 15 | 239 | 7672086 | 30167.4 | 1163 | 1142 | 254.3 |
| A | 8 | 15 | 139958 | 545.92 | 1163 | 1142 | 254.3 |
| A | 4 | 2 | 77968 | 302.13 | 1163 | 1142 | 254.3 |
| B | 4 | 239 | 773391 | 3381.81 | 1208 | 1175 | 228.3 |
| B | 3 | 64 | 321257 | 1401.75 | 1208 | 1175 | 228.3 |
| B | 0 | 214 | 85130 | 367.67 | 1208 | 1175 | 228.3 |
| C | 15 | 208 | 58407 | 215.41 | 1196 | 1179 | 265.7 |
| C | 6 | 96 | 29002 | 104.73 | 1196 | 1179 | 265.7 |
| C | 7 | 236 | 20828 | 73.96 | 1196 | 1179 | 265.7 |
| D | 5 | 222 | 2113437 | 7757.47 | 1185 | 1143 | 272.3 |
| D | 1 | 52 | 1505844 | 5526.07 | 1185 | 1143 | 272.3 |
| D | 2 | 234 | 77917 | 281.96 | 1185 | 1143 | 272.3 |
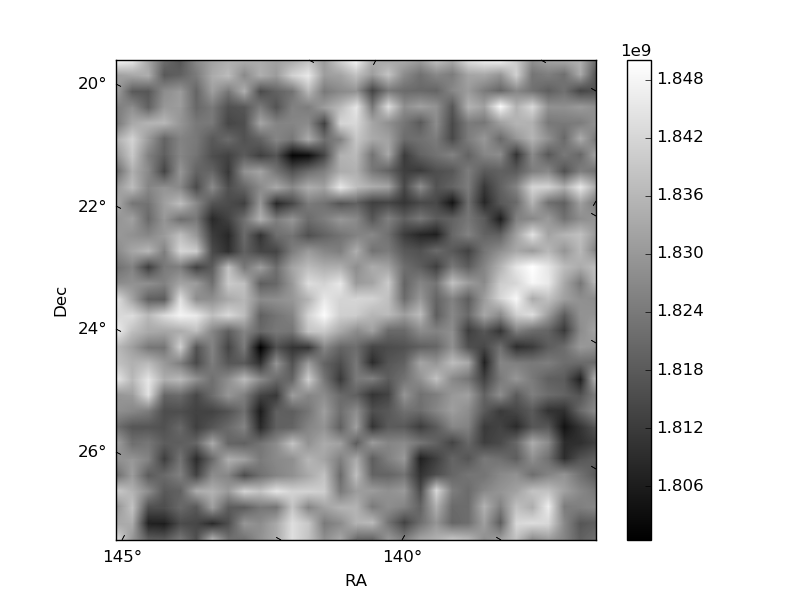
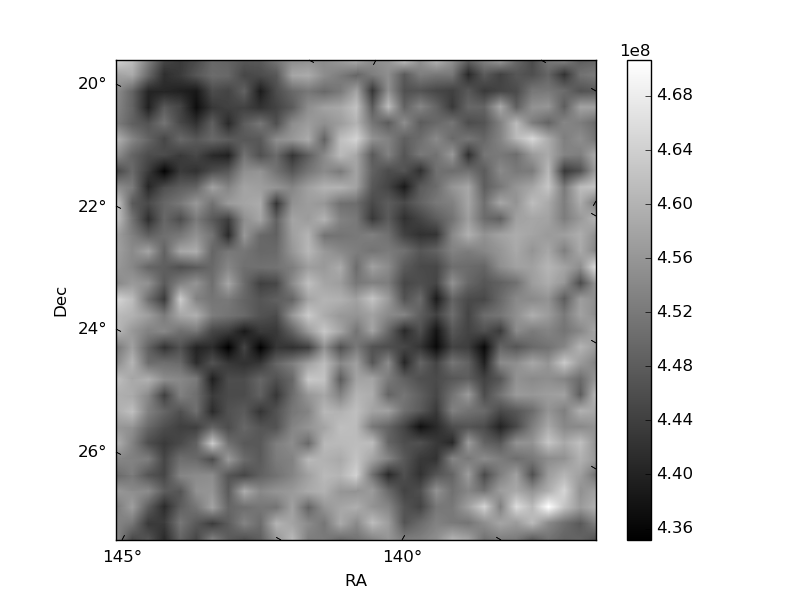
Histogram calculated using DETX and DETY for each event in the final _common_clean file
| Quadrant A | 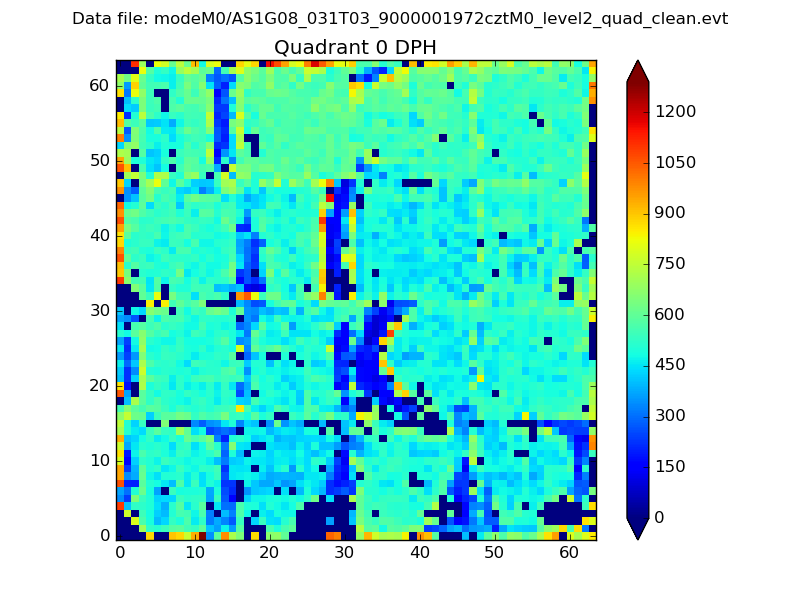 |
 |
Quadrant B |
|---|---|---|---|
| Quadrant D | 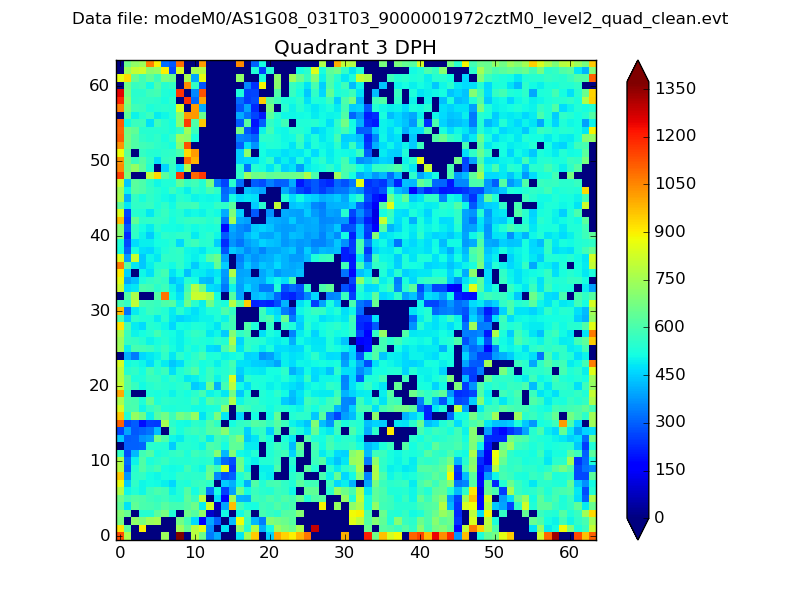 |
 |
Quadrant C |
| Plot type | Count rate plots | Images |
|---|---|---|
| Comparison with Poisson distribution Blue bars denote a histogram of data divided into 1 sec bins. Red curve is a Poisson curve with rate = median count rate of data. |
 |
 |
| Quadrant-wise count rates Data is divided into 100 sec bins |
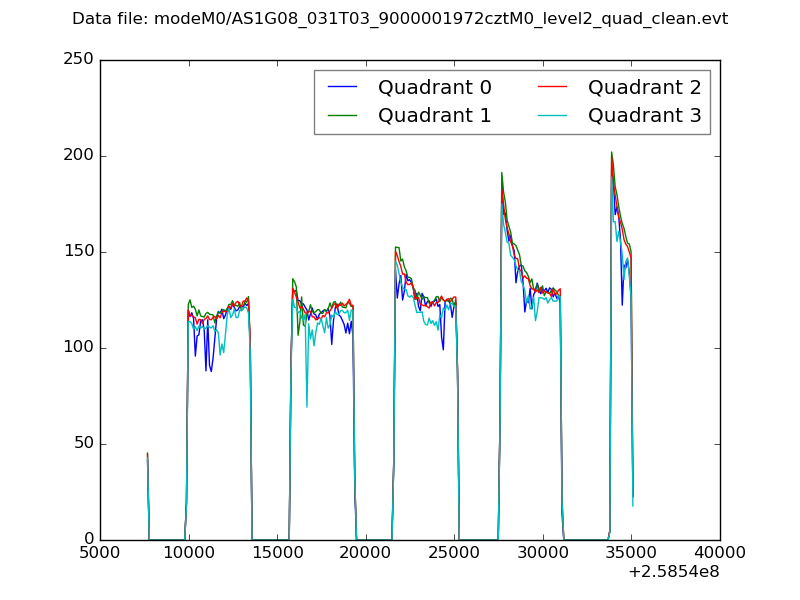 |
|
| Module-wise count rates for Quadrant A Data is divided into 100 sec bins |
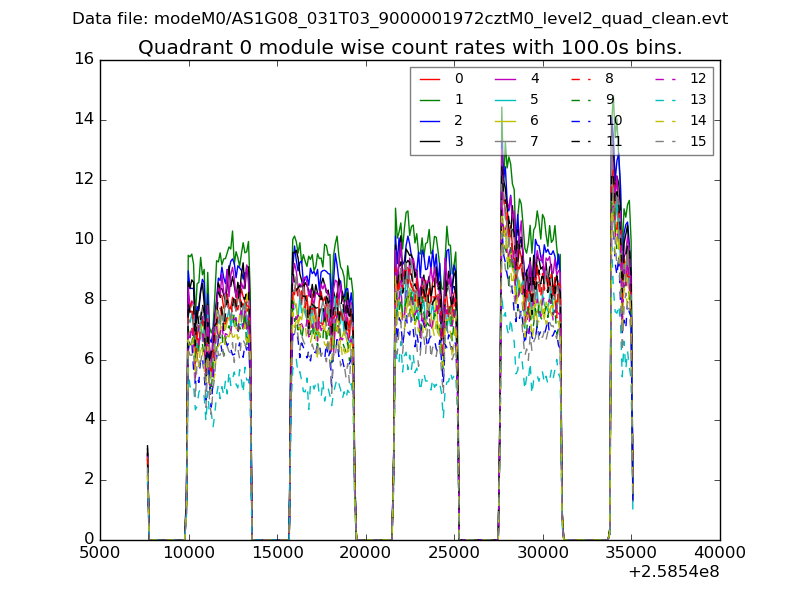 |
 |
| Module-wise count rates for Quadrant B Data is divided into 100 sec bins |
 |
 |
| Module-wise count rates for Quadrant C Data is divided into 100 sec bins |
 |
 |
| Module-wise count rates for Quadrant D Data is divided into 100 sec bins |
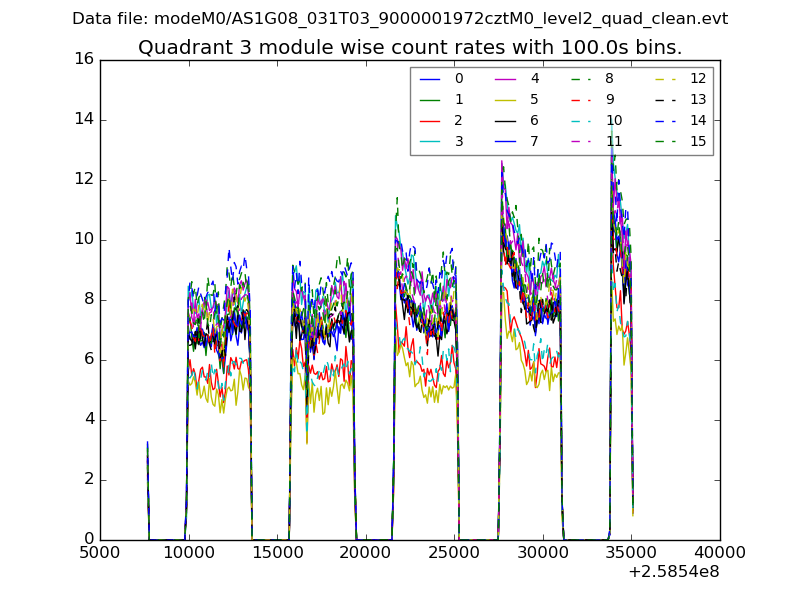 |
 |
| Parameter | Plot |
|---|---|
| CZT HV Monitor |  |
| D_VDD |  |
| Temperature 1 |  |
| Veto HV Monitor | 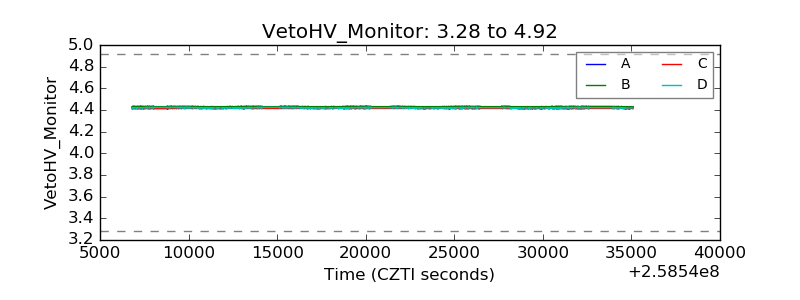 |
| Veto LLD |  |
| Alpha Counter |  |
| _CPM_Rate |  |
| CZT Counter |  |
| +2.5 Volts monitor |  |
| +5 Volts monitor |  |
| _ROLL_ROT |  |
| _Roll_DEC |  |
| _Roll_RA |  |
| Veto Counter | 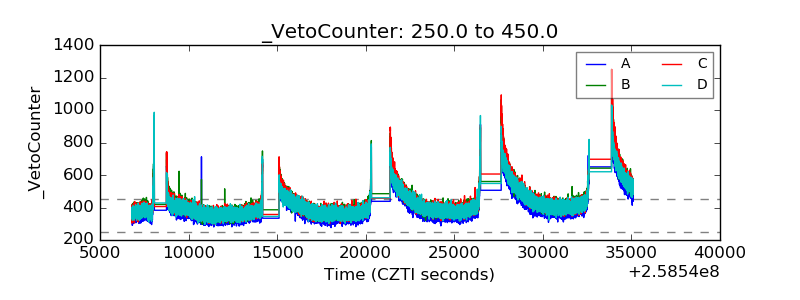 |