| Param | Original file | Final file |
|---|---|---|
| Filename | modeM0/AS1A04_167T02_9000001974cztM0_level2_bc.evt | modeM0/AS1A04_167T02_9000001974cztM0_level2_quad_clean.evt |
| Size (bytes) | 2,017,169,280 | 491,978,880 |
| Size | 1.9 GB | 469.2 MB |
| Events in quadrant A | 11,924,743 | 3,108,799 |
| Events in quadrant B | 14,592,383 | 2,925,938 |
| Events in quadrant C | 8,112,577 | 3,237,910 |
| Events in quadrant D | 23,759,465 | 2,906,975 |
| Mode M9 | |||
|---|---|---|---|
| Quadrant | BADHDUFLAG | Total packets | Discarded packets |
| A | 0 | 58 | 0 |
| B | 0 | 59 | 0 |
| C | 0 | 58 | 0 |
| D | 0 | 59 | 0 |
| Mode SS | |||
|---|---|---|---|
| Quadrant | BADHDUFLAG | Total packets | Discarded packets |
| A | 0 | 808 | 0 |
| B | 0 | 810 | 0 |
| C | 0 | 808 | 0 |
| D | 0 | 808 | 0 |
| Mode M0 | |||
|---|---|---|---|
| Quadrant | BADHDUFLAG | Total packets | Discarded packets |
| A | 0 | 95904 | 0 |
| B | 0 | 123563 | 0 |
| C | 0 | 82231 | 0 |
| D | 0 | 141175 | 0 |
| Quadrant | Total seconds | Saturated seconds | Saturation percentage |
|---|---|---|---|
| A | 39583 | 1070 | 2.703181% |
| B | 39645 | 7317 | 18.456300% |
| C | 39680 | 308 | 0.776210% |
| D | 39466 | 4875 | 12.352405% |
Noise dominated data is calculated using 1-second bins in cleaned event files. If a bin has >2000 counts, and if more than 50% of those come from <1% of pixels, then it is considered to be noise-dominated and hence unusable.
| Quadrant | # 1 sec bins | Bins with >0 counts | Bins with >2000 counts | High rate bins dominated by noise | Noise dominated (total time) | Noise dominated (detector-on time) | Marked lightcurve |
|---|---|---|---|---|---|---|---|
| A | 51494 | 39835 | 111 | 111 | 0.22% | 0.28% | 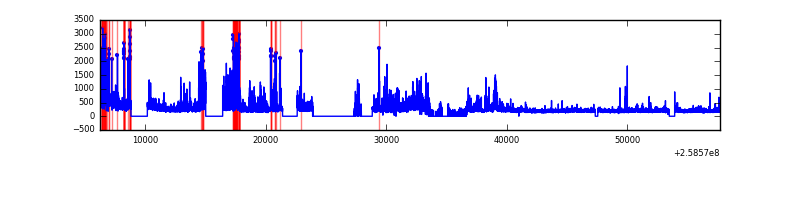 |
| B | 51493 | 39678 | 314 | 314 | 0.61% | 0.79% |  |
| C | 51494 | 39951 | 2 | 2 | 0.00% | 0.01% | 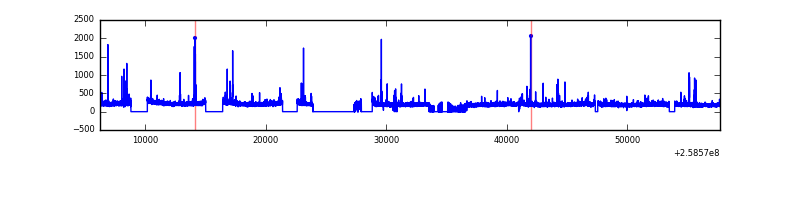 |
| D | 51494 | 39631 | 562 | 562 | 1.09% | 1.42% |  |
Top three noisy pixels from each quadrant. If the there are fewer than three noisy pixels in the level2.evt file, extra rows are filled as -1
| Pixel properties | Quadrant properties | ||||||
|---|---|---|---|---|---|---|---|
| Quadrant | DetID | PixID | Counts | Sigma | Mean | Median | Sigma |
| A | 15 | 239 | 2901015 | 6717.04 | 1995 | 1955 | 431.6 |
| A | 8 | 15 | 1087311 | 2514.74 | 1995 | 1955 | 431.6 |
| A | 1 | 162 | 124075 | 282.95 | 1995 | 1955 | 431.6 |
| B | 4 | 239 | 6407741 | 19017.4 | 1794 | 1747 | 336.8 |
| B | 3 | 64 | 283608 | 836.76 | 1794 | 1747 | 336.8 |
| B | 0 | 244 | 253318 | 746.84 | 1794 | 1747 | 336.8 |
| C | 15 | 208 | 89219 | 197.67 | 2021 | 1990 | 441.3 |
| C | 6 | 96 | 73931 | 163.03 | 2021 | 1990 | 441.3 |
| C | 14 | 234 | 27307 | 57.37 | 2021 | 1990 | 441.3 |
| D | 1 | 52 | 10057933 | 22824.07 | 1905 | 1837 | 440.6 |
| D | 13 | 249 | 5150439 | 11685.65 | 1905 | 1837 | 440.6 |
| D | 5 | 222 | 525926 | 1189.51 | 1905 | 1837 | 440.6 |
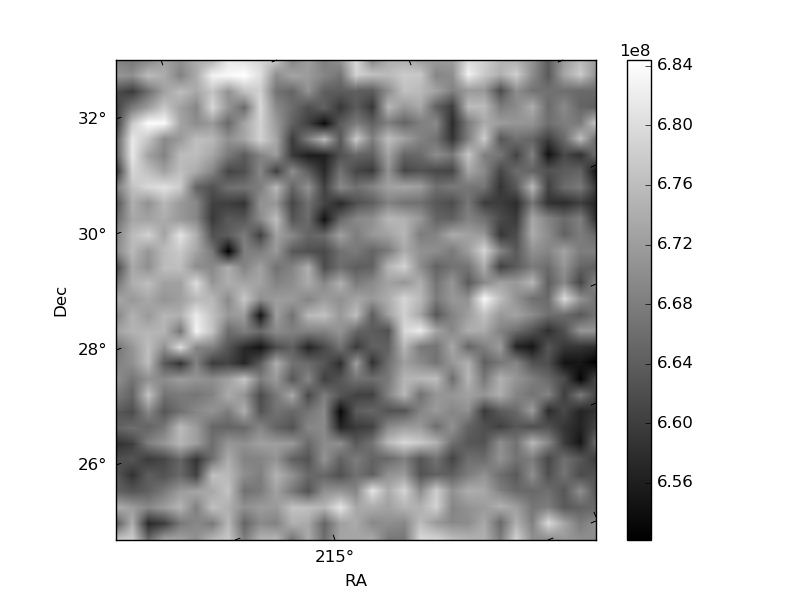
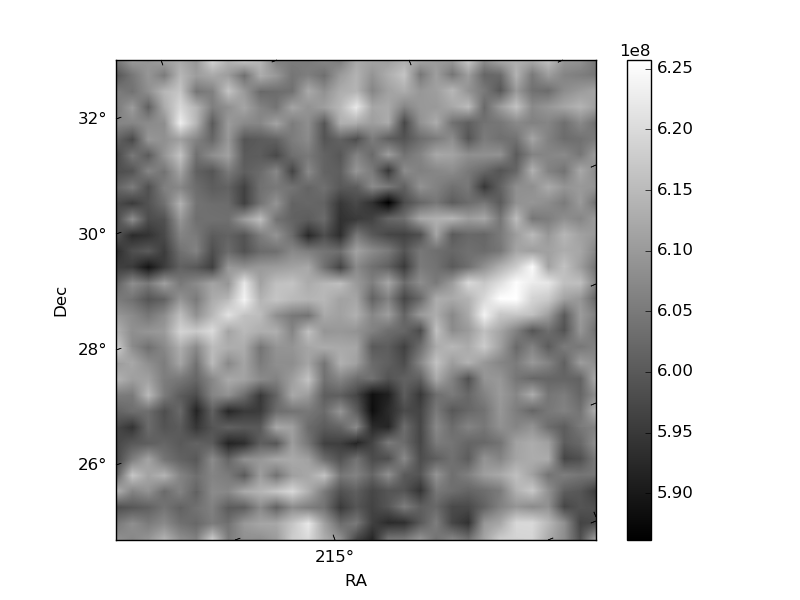
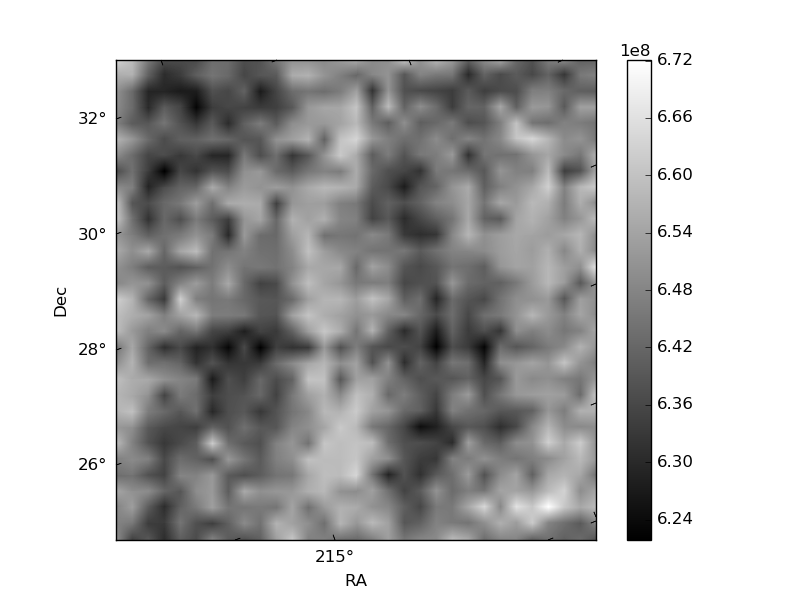
Histogram calculated using DETX and DETY for each event in the final _common_clean file
| Quadrant A |  |
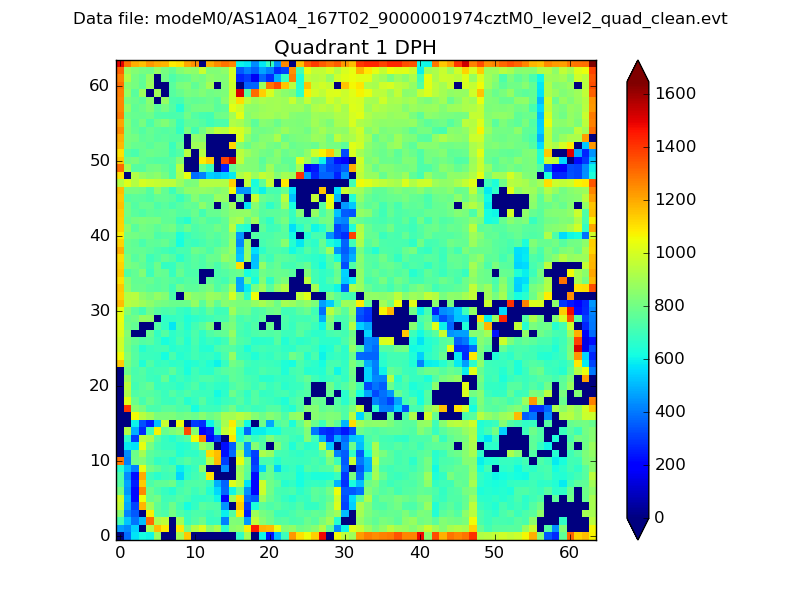 |
Quadrant B |
|---|---|---|---|
| Quadrant D |  |
 |
Quadrant C |
| Plot type | Count rate plots | Images |
|---|---|---|
| Comparison with Poisson distribution Blue bars denote a histogram of data divided into 1 sec bins. Red curve is a Poisson curve with rate = median count rate of data. |
 |
 |
| Quadrant-wise count rates Data is divided into 100 sec bins |
 |
|
| Module-wise count rates for Quadrant A Data is divided into 100 sec bins |
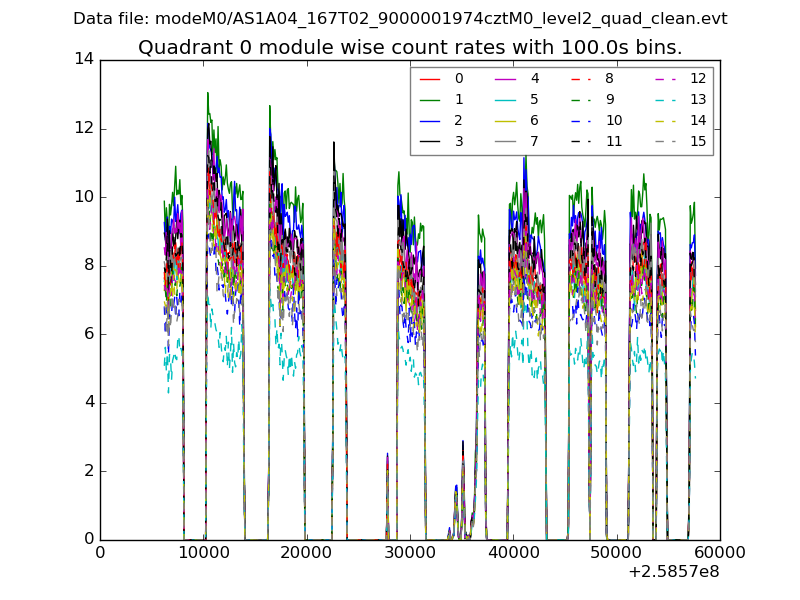 |
 |
| Module-wise count rates for Quadrant B Data is divided into 100 sec bins |
 |
 |
| Module-wise count rates for Quadrant C Data is divided into 100 sec bins |
 |
 |
| Module-wise count rates for Quadrant D Data is divided into 100 sec bins |
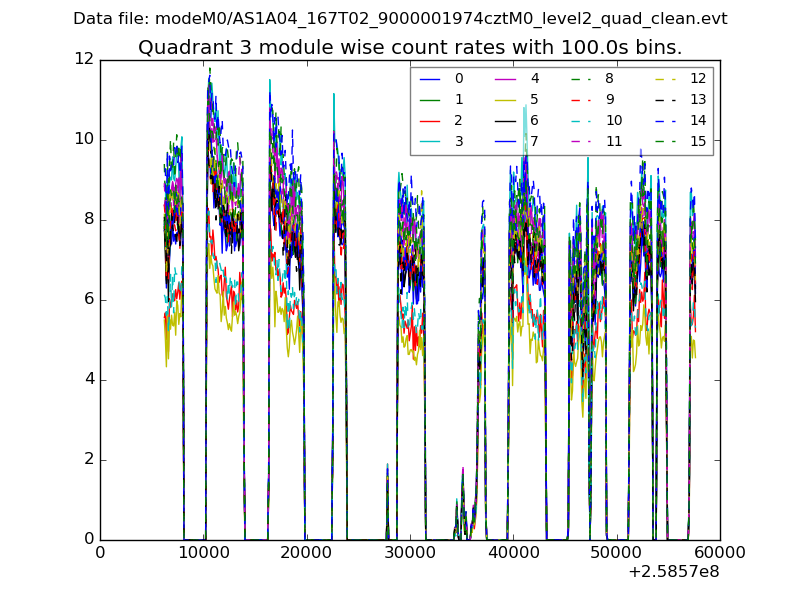 |
 |
| Parameter | Plot |
|---|---|
| CZT HV Monitor |  |
| D_VDD |  |
| Temperature 1 |  |
| Veto HV Monitor | 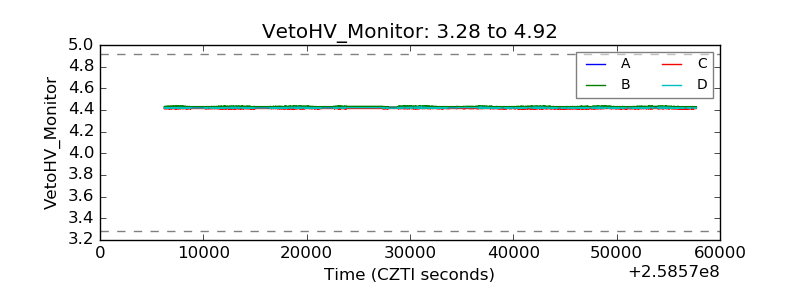 |
| Veto LLD |  |
| Alpha Counter |  |
| _CPM_Rate | 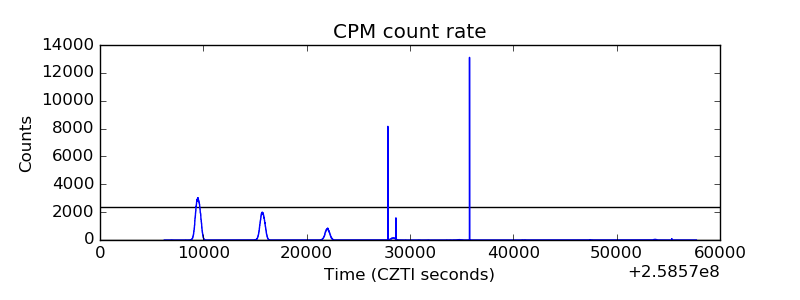 |
| CZT Counter | 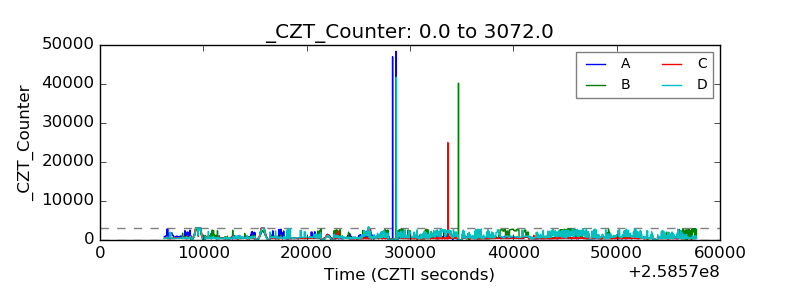 |
| +2.5 Volts monitor |  |
| +5 Volts monitor |  |
| _ROLL_ROT |  |
| _Roll_DEC |  |
| _Roll_RA | 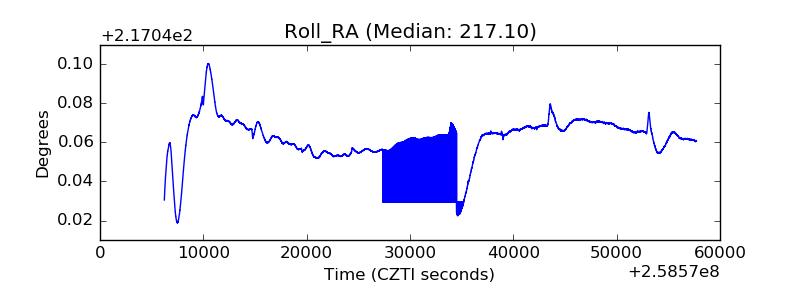 |
| Veto Counter |  |