| Param | Original file | Final file |
|---|---|---|
| Filename | modeM0/AS1G08_077T01_9000001970cztM0_level2_bc.evt | modeM0/AS1G08_077T01_9000001970cztM0_level2_quad_clean.evt |
| Size (bytes) | 6,831,414,720 | 2,236,357,440 |
| Size | 6.4 GB | 2.1 GB |
| Events in quadrant A | 50,788,686 | 14,110,176 |
| Events in quadrant B | 68,200,985 | 13,176,899 |
| Events in quadrant C | 33,175,934 | 15,042,463 |
| Events in quadrant D | 43,683,615 | 14,299,428 |
| Mode M0 | |||
|---|---|---|---|
| Quadrant | BADHDUFLAG | Total packets | Discarded packets |
| A | 0 | 400308 | 0 |
| B | 0 | 515224 | 0 |
| C | 0 | 335212 | 0 |
| D | 0 | 364739 | 0 |
| Mode SS | |||
|---|---|---|---|
| Quadrant | BADHDUFLAG | Total packets | Discarded packets |
| A | 0 | 3302 | 0 |
| B | 0 | 3302 | 0 |
| C | 0 | 3302 | 0 |
| D | 0 | 3302 | 0 |
| Mode M9 | |||
|---|---|---|---|
| Quadrant | BADHDUFLAG | Total packets | Discarded packets |
| A | 0 | 237 | 0 |
| B | 0 | 237 | 0 |
| C | 0 | 237 | 0 |
| D | 0 | 237 | 0 |
| Quadrant | Total seconds | Saturated seconds | Saturation percentage |
|---|---|---|---|
| A | 162043 | 8975 | 5.538653% |
| B | 162043 | 28487 | 17.579902% |
| C | 162043 | 1365 | 0.842369% |
| D | 162043 | 3442 | 2.124128% |
Noise dominated data is calculated using 1-second bins in cleaned event files. If a bin has >2000 counts, and if more than 50% of those come from <1% of pixels, then it is considered to be noise-dominated and hence unusable.
| Quadrant | # 1 sec bins | Bins with >0 counts | Bins with >2000 counts | High rate bins dominated by noise | Noise dominated (total time) | Noise dominated (detector-on time) | Marked lightcurve |
|---|---|---|---|---|---|---|---|
| A | 185789 | 162024 | 2995 | 2995 | 1.61% | 1.85% |  |
| B | 185789 | 161641 | 2990 | 2990 | 1.61% | 1.85% |  |
| C | 185789 | 162046 | 16 | 16 | 0.01% | 0.01% |  |
| D | 185789 | 162047 | 952 | 952 | 0.51% | 0.59% | 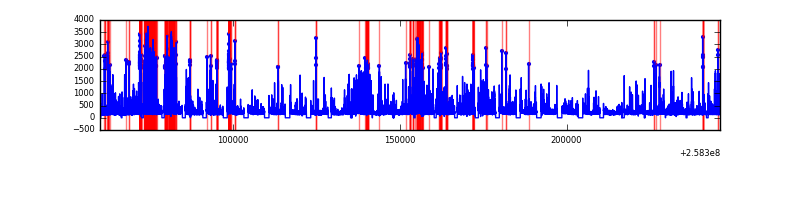 |
Top three noisy pixels from each quadrant. If the there are fewer than three noisy pixels in the level2.evt file, extra rows are filled as -1
| Pixel properties | Quadrant properties | ||||||
|---|---|---|---|---|---|---|---|
| Quadrant | DetID | PixID | Counts | Sigma | Mean | Median | Sigma |
| A | 15 | 239 | 17954140 | 10512.52 | 7825 | 7678 | 1707.2 |
| A | 12 | 189 | 2017001 | 1177.0 | 7825 | 7678 | 1707.2 |
| A | 1 | 162 | 268834 | 152.98 | 7825 | 7678 | 1707.2 |
| B | 4 | 239 | 37766432 | 27365.47 | 7320 | 7131 | 1379.8 |
| B | 3 | 64 | 522419 | 373.45 | 7320 | 7131 | 1379.8 |
| B | 0 | 230 | 488184 | 348.64 | 7320 | 7131 | 1379.8 |
| C | 15 | 208 | 700713 | 385.75 | 8136 | 8032 | 1795.7 |
| C | 3 | 233 | 292811 | 158.59 | 8136 | 8032 | 1795.7 |
| C | 14 | 234 | 177927 | 94.61 | 8136 | 8032 | 1795.7 |
| D | 1 | 52 | 6270272 | 3382.06 | 8060 | 7790 | 1851.7 |
| D | 10 | 157 | 2717117 | 1463.17 | 8060 | 7790 | 1851.7 |
| D | 8 | 195 | 1544358 | 829.82 | 8060 | 7790 | 1851.7 |
Histogram calculated using DETX and DETY for each event in the final _common_clean file
| Quadrant A | 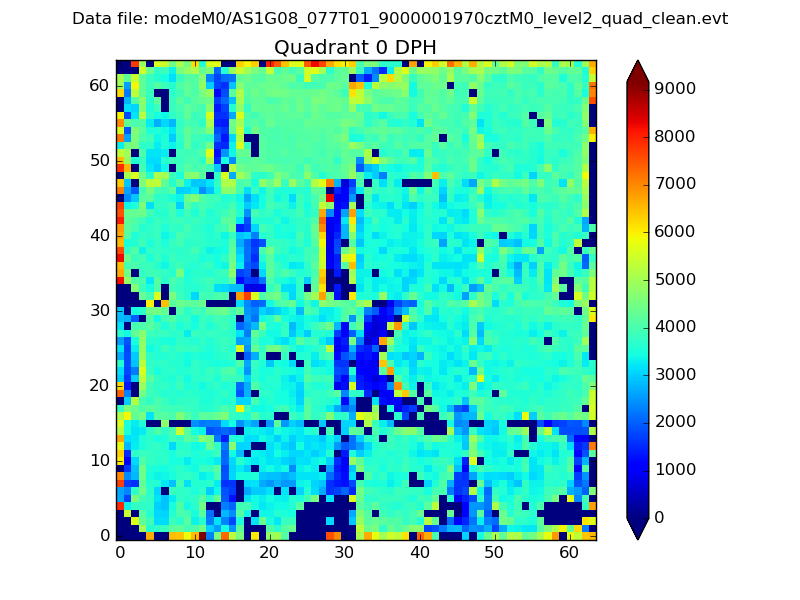 |
 |
Quadrant B |
|---|---|---|---|
| Quadrant D |  |
 |
Quadrant C |
| Plot type | Count rate plots | Images |
|---|---|---|
| Comparison with Poisson distribution Blue bars denote a histogram of data divided into 1 sec bins. Red curve is a Poisson curve with rate = median count rate of data. |
 |
 |
| Quadrant-wise count rates Data is divided into 100 sec bins |
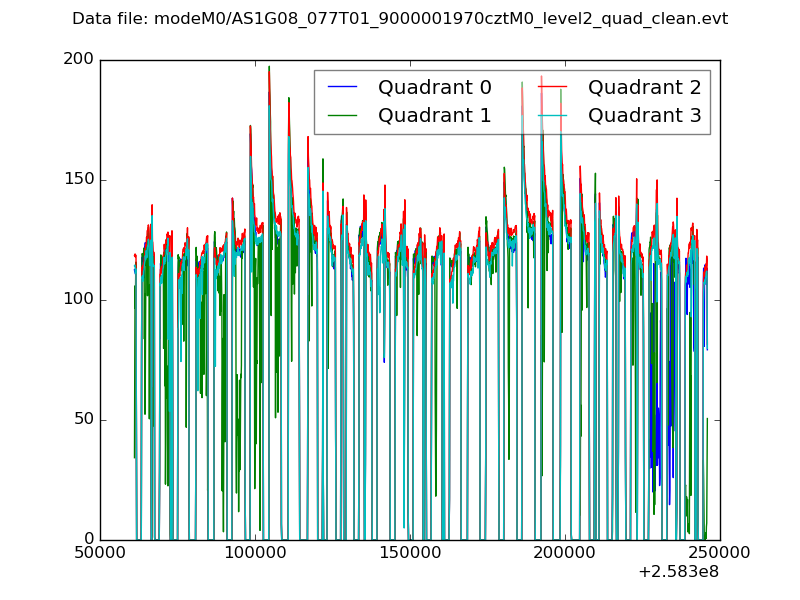 |
|
| Module-wise count rates for Quadrant A Data is divided into 100 sec bins |
 |
 |
| Module-wise count rates for Quadrant B Data is divided into 100 sec bins |
 |
 |
| Module-wise count rates for Quadrant C Data is divided into 100 sec bins |
 |
 |
| Module-wise count rates for Quadrant D Data is divided into 100 sec bins |
 |
 |
| Parameter | Plot |
|---|---|
| CZT HV Monitor |  |
| D_VDD |  |
| Temperature 1 |  |
| Veto HV Monitor |  |
| Veto LLD |  |
| Alpha Counter |  |
| _CPM_Rate |  |
| CZT Counter |  |
| +2.5 Volts monitor |  |
| +5 Volts monitor |  |
| _ROLL_ROT | 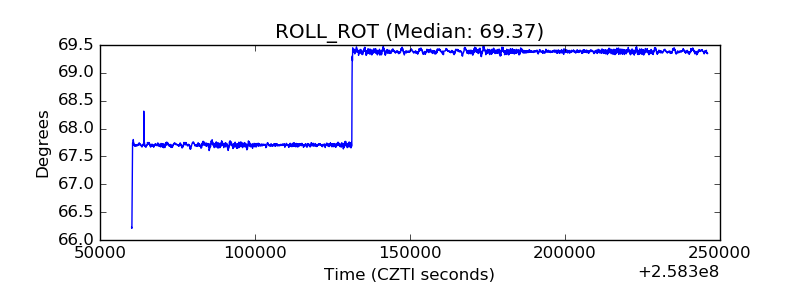 |
| _Roll_DEC |  |
| _Roll_RA | 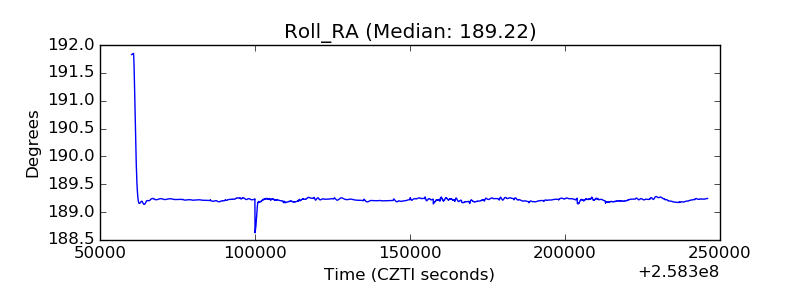 |
| Veto Counter |  |