| Param | Original file | Final file |
|---|---|---|
| Filename | modeM0/AS1A04_216T01_9000001968cztM0_level2_bc.evt | modeM0/AS1A04_216T01_9000001968cztM0_level2_quad_clean.evt |
| Size (bytes) | 4,641,621,120 | 1,741,766,400 |
| Size | 4.3 GB | 1.6 GB |
| Events in quadrant A | 26,597,799 | 11,477,028 |
| Events in quadrant B | 42,563,263 | 10,890,887 |
| Events in quadrant C | 24,045,252 | 11,494,438 |
| Events in quadrant D | 39,258,777 | 10,737,876 |
| Mode SS | |||
|---|---|---|---|
| Quadrant | BADHDUFLAG | Total packets | Discarded packets |
| A | 0 | 2422 | 0 |
| B | 0 | 2422 | 0 |
| C | 0 | 2422 | 0 |
| D | 0 | 2422 | 0 |
| Mode M0 | |||
|---|---|---|---|
| Quadrant | BADHDUFLAG | Total packets | Discarded packets |
| A | 0 | 252556 | 0 |
| B | 0 | 332608 | 0 |
| C | 0 | 245440 | 0 |
| D | 0 | 291624 | 0 |
| Mode M9 | |||
|---|---|---|---|
| Quadrant | BADHDUFLAG | Total packets | Discarded packets |
| A | 0 | 205 | 0 |
| B | 0 | 205 | 0 |
| C | 0 | 205 | 0 |
| D | 0 | 205 | 0 |
| Quadrant | Total seconds | Saturated seconds | Saturation percentage |
|---|---|---|---|
| A | 119015 | 1934 | 1.625005% |
| B | 119015 | 13233 | 11.118767% |
| C | 119015 | 1385 | 1.163719% |
| D | 119015 | 3734 | 3.137420% |
Noise dominated data is calculated using 1-second bins in cleaned event files. If a bin has >2000 counts, and if more than 50% of those come from <1% of pixels, then it is considered to be noise-dominated and hence unusable.
| Quadrant | # 1 sec bins | Bins with >0 counts | Bins with >2000 counts | High rate bins dominated by noise | Noise dominated (total time) | Noise dominated (detector-on time) | Marked lightcurve |
|---|---|---|---|---|---|---|---|
| A | 139201 | 119020 | 115 | 115 | 0.08% | 0.10% |  |
| B | 139201 | 118956 | 1037 | 1037 | 0.74% | 0.87% |  |
| C | 139201 | 119020 | 14 | 14 | 0.01% | 0.01% | 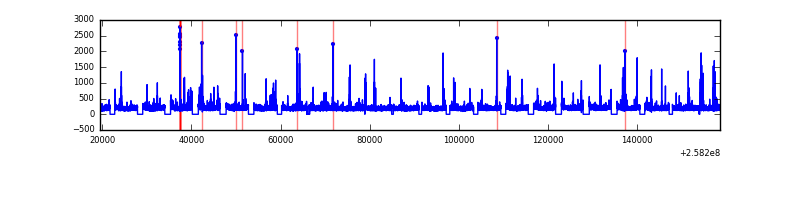 |
| D | 139201 | 119020 | 717 | 717 | 0.52% | 0.60% |  |
Top three noisy pixels from each quadrant. If the there are fewer than three noisy pixels in the level2.evt file, extra rows are filled as -1
| Pixel properties | Quadrant properties | ||||||
|---|---|---|---|---|---|---|---|
| Quadrant | DetID | PixID | Counts | Sigma | Mean | Median | Sigma |
| A | 15 | 239 | 1130897 | 858.12 | 6025 | 5916 | 1311.0 |
| A | 12 | 189 | 845227 | 640.21 | 6025 | 5916 | 1311.0 |
| A | 8 | 15 | 408583 | 307.15 | 6025 | 5916 | 1311.0 |
| B | 4 | 239 | 17922926 | 16367.28 | 5810 | 5665 | 1094.7 |
| B | 3 | 64 | 473003 | 426.91 | 5810 | 5665 | 1094.7 |
| B | 5 | 32 | 289704 | 259.47 | 5810 | 5665 | 1094.7 |
| C | 15 | 208 | 557766 | 421.64 | 5962 | 5890 | 1308.9 |
| C | 14 | 234 | 106647 | 76.98 | 5962 | 5890 | 1308.9 |
| C | 8 | 222 | 40959 | 26.79 | 5962 | 5890 | 1308.9 |
| D | 1 | 52 | 6950194 | 5156.18 | 5849 | 5652 | 1346.8 |
| D | 8 | 195 | 6096859 | 4522.59 | 5849 | 5652 | 1346.8 |
| D | 13 | 122 | 2288581 | 1695.03 | 5849 | 5652 | 1346.8 |
Histogram calculated using DETX and DETY for each event in the final _common_clean file
| Quadrant A |  |
 |
Quadrant B |
|---|---|---|---|
| Quadrant D | 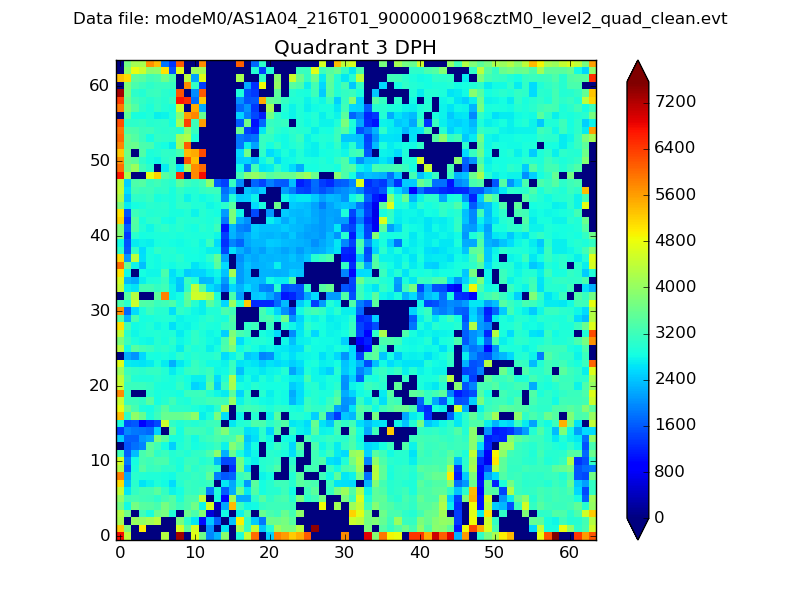 |
 |
Quadrant C |
| Plot type | Count rate plots | Images |
|---|---|---|
| Comparison with Poisson distribution Blue bars denote a histogram of data divided into 1 sec bins. Red curve is a Poisson curve with rate = median count rate of data. |
 |
 |
| Quadrant-wise count rates Data is divided into 100 sec bins |
 |
|
| Module-wise count rates for Quadrant A Data is divided into 100 sec bins |
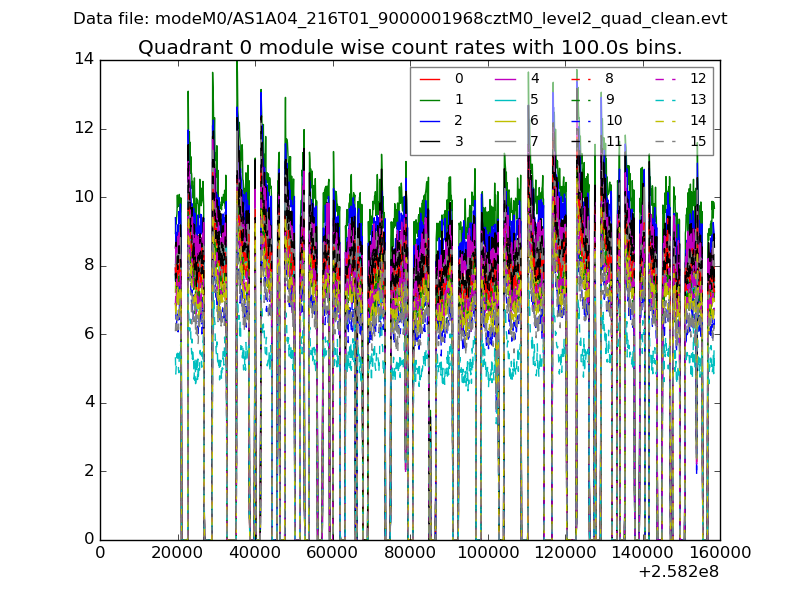 |
 |
| Module-wise count rates for Quadrant B Data is divided into 100 sec bins |
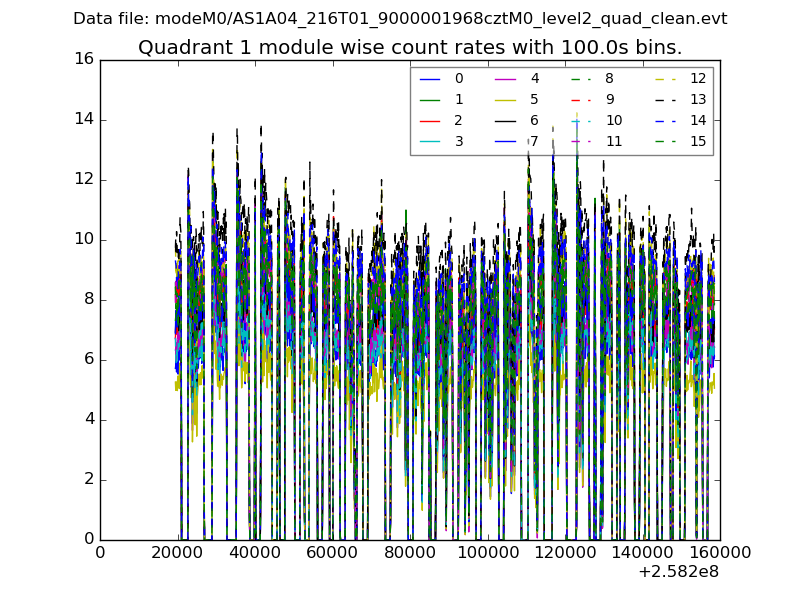 |
 |
| Module-wise count rates for Quadrant C Data is divided into 100 sec bins |
 |
 |
| Module-wise count rates for Quadrant D Data is divided into 100 sec bins |
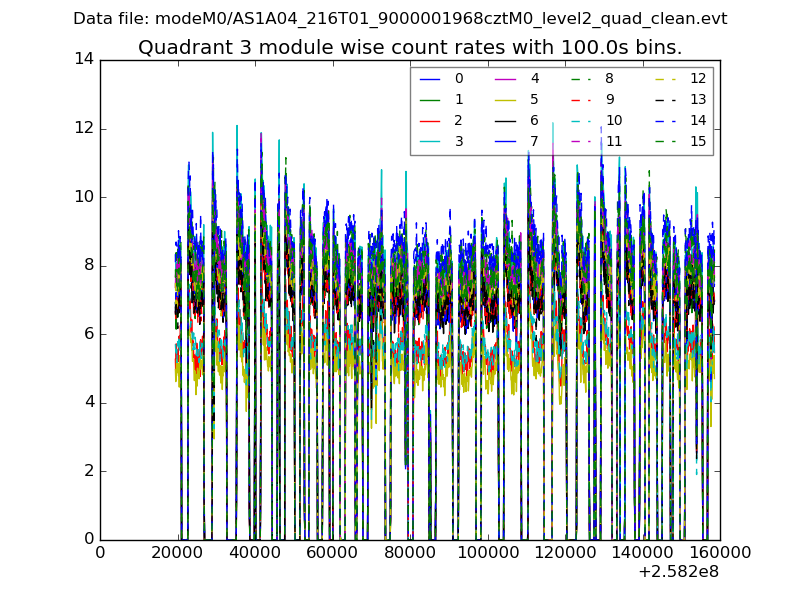 |
 |
| Parameter | Plot |
|---|---|
| CZT HV Monitor |  |
| D_VDD |  |
| Temperature 1 |  |
| Veto HV Monitor |  |
| Veto LLD |  |
| Alpha Counter |  |
| _CPM_Rate |  |
| CZT Counter | 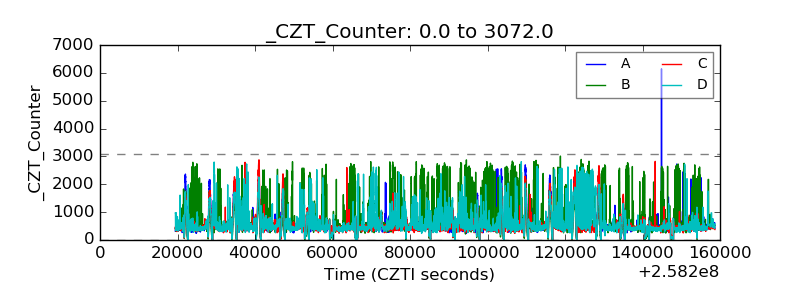 |
| +2.5 Volts monitor | 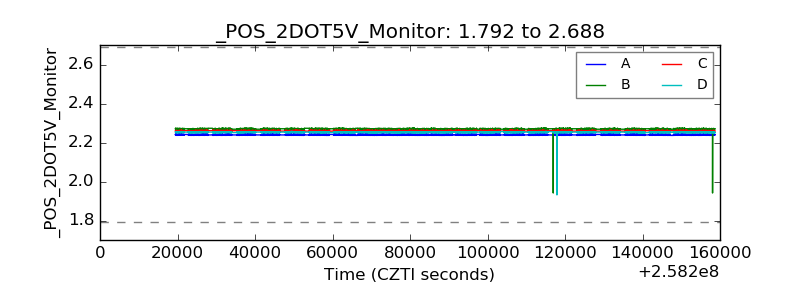 |
| +5 Volts monitor |  |
| _ROLL_ROT |  |
| _Roll_DEC | 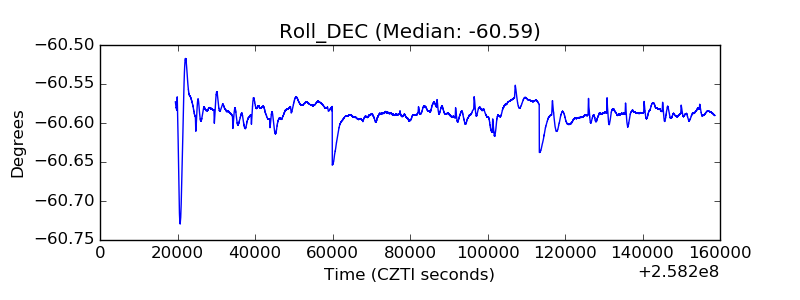 |
| _Roll_RA |  |
| Veto Counter |  |