| Param | Original file | Final file |
|---|---|---|
| Filename | modeM0/AS1A04_104T04_9000001966cztM0_level2_bc.evt | modeM0/AS1A04_104T04_9000001966cztM0_level2_quad_clean.evt |
| Size (bytes) | 3,053,329,920 | 882,123,840 |
| Size | 2.8 GB | 841.3 MB |
| Events in quadrant A | 14,587,427 | 5,577,264 |
| Events in quadrant B | 23,179,530 | 5,604,528 |
| Events in quadrant C | 14,035,823 | 5,715,213 |
| Events in quadrant D | 35,901,448 | 5,023,888 |
| Mode M9 | |||
|---|---|---|---|
| Quadrant | BADHDUFLAG | Total packets | Discarded packets |
| A | 0 | 108 | 0 |
| B | 0 | 108 | 0 |
| C | 0 | 108 | 0 |
| D | 0 | 108 | 0 |
| Mode M0 | |||
|---|---|---|---|
| Quadrant | BADHDUFLAG | Total packets | Discarded packets |
| A | 0 | 146210 | 0 |
| B | 0 | 179469 | 0 |
| C | 0 | 144410 | 0 |
| D | 0 | 246781 | 0 |
| Mode SS | |||
|---|---|---|---|
| Quadrant | BADHDUFLAG | Total packets | Discarded packets |
| A | 0 | 1428 | 0 |
| B | 0 | 1428 | 0 |
| C | 0 | 1428 | 0 |
| D | 0 | 1428 | 0 |
| Quadrant | Total seconds | Saturated seconds | Saturation percentage |
|---|---|---|---|
| A | 69917 | 1044 | 1.493199% |
| B | 69919 | 5005 | 7.158283% |
| C | 69915 | 708 | 1.012658% |
| D | 69916 | 11032 | 15.778935% |
Noise dominated data is calculated using 1-second bins in cleaned event files. If a bin has >2000 counts, and if more than 50% of those come from <1% of pixels, then it is considered to be noise-dominated and hence unusable.
| Quadrant | # 1 sec bins | Bins with >0 counts | Bins with >2000 counts | High rate bins dominated by noise | Noise dominated (total time) | Noise dominated (detector-on time) | Marked lightcurve |
|---|---|---|---|---|---|---|---|
| A | 80770 | 69922 | 23 | 23 | 0.03% | 0.03% |  |
| B | 80770 | 69907 | 825 | 825 | 1.02% | 1.18% | 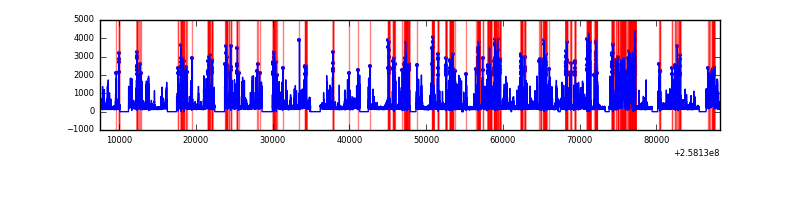 |
| C | 80770 | 69925 | 4 | 4 | 0.00% | 0.01% |  |
| D | 80770 | 69910 | 79 | 79 | 0.10% | 0.11% |  |
Top three noisy pixels from each quadrant. If the there are fewer than three noisy pixels in the level2.evt file, extra rows are filled as -1
| Pixel properties | Quadrant properties | ||||||
|---|---|---|---|---|---|---|---|
| Quadrant | DetID | PixID | Counts | Sigma | Mean | Median | Sigma |
| A | 8 | 15 | 289046 | 375.54 | 3534 | 3464 | 760.5 |
| A | 12 | 96 | 265238 | 344.23 | 3534 | 3464 | 760.5 |
| A | 1 | 162 | 148259 | 190.41 | 3534 | 3464 | 760.5 |
| B | 4 | 239 | 6510104 | 9877.64 | 3512 | 3414 | 658.7 |
| B | 0 | 85 | 1177310 | 1782.06 | 3512 | 3414 | 658.7 |
| B | 3 | 64 | 646554 | 976.33 | 3512 | 3414 | 658.7 |
| C | 15 | 208 | 181265 | 231.67 | 3528 | 3477 | 767.4 |
| C | 14 | 234 | 26313 | 29.76 | 3528 | 3477 | 767.4 |
| C | 8 | 222 | 23869 | 26.57 | 3528 | 3477 | 767.4 |
| D | 13 | 122 | 17802190 | 23591.62 | 3256 | 3133 | 754.5 |
| D | 1 | 52 | 2608744 | 3453.59 | 3256 | 3133 | 754.5 |
| D | 8 | 195 | 1824494 | 2414.11 | 3256 | 3133 | 754.5 |
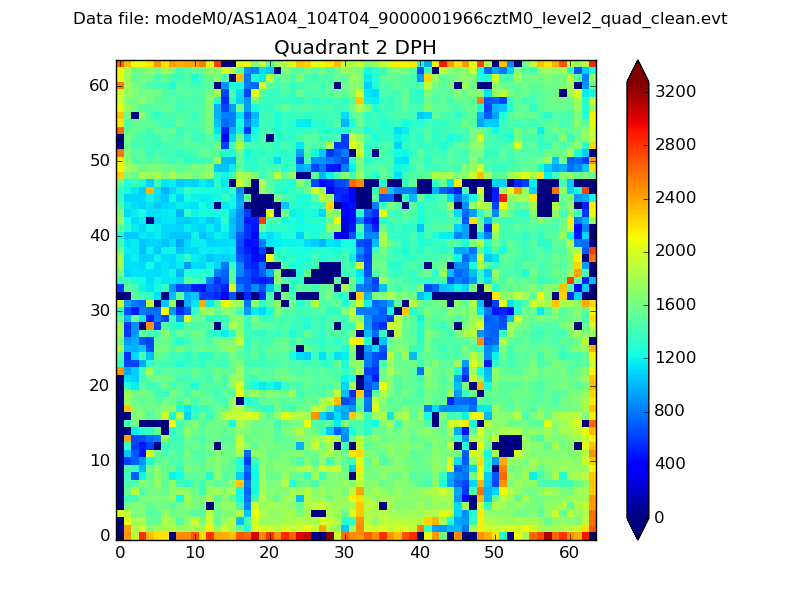
Histogram calculated using DETX and DETY for each event in the final _common_clean file
| Quadrant A |  |
 |
Quadrant B |
|---|---|---|---|
| Quadrant D |  |
 |
Quadrant C |
| Plot type | Count rate plots | Images |
|---|---|---|
| Comparison with Poisson distribution Blue bars denote a histogram of data divided into 1 sec bins. Red curve is a Poisson curve with rate = median count rate of data. |
 |
 |
| Quadrant-wise count rates Data is divided into 100 sec bins |
 |
|
| Module-wise count rates for Quadrant A Data is divided into 100 sec bins |
 |
 |
| Module-wise count rates for Quadrant B Data is divided into 100 sec bins |
 |
 |
| Module-wise count rates for Quadrant C Data is divided into 100 sec bins |
 |
 |
| Module-wise count rates for Quadrant D Data is divided into 100 sec bins |
 |
 |
| Parameter | Plot |
|---|---|
| CZT HV Monitor |  |
| D_VDD |  |
| Temperature 1 |  |
| Veto HV Monitor | 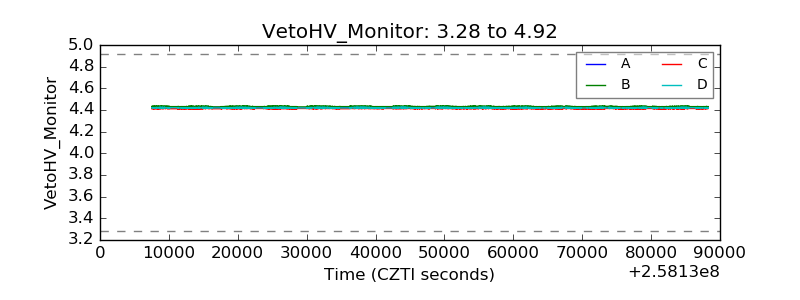 |
| Veto LLD |  |
| Alpha Counter |  |
| _CPM_Rate |  |
| CZT Counter |  |
| +2.5 Volts monitor | 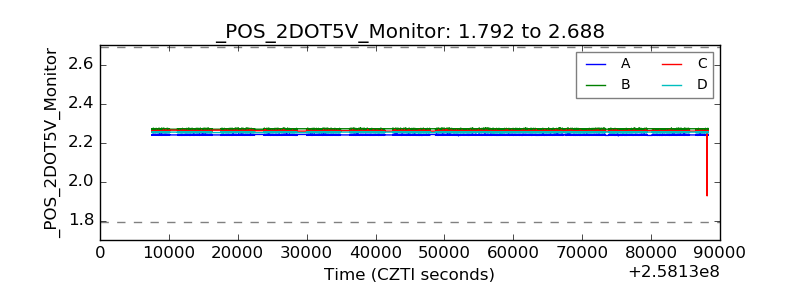 |
| +5 Volts monitor | 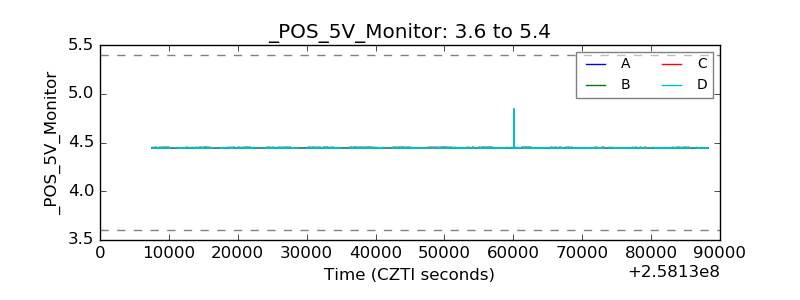 |
| _ROLL_ROT |  |
| _Roll_DEC | 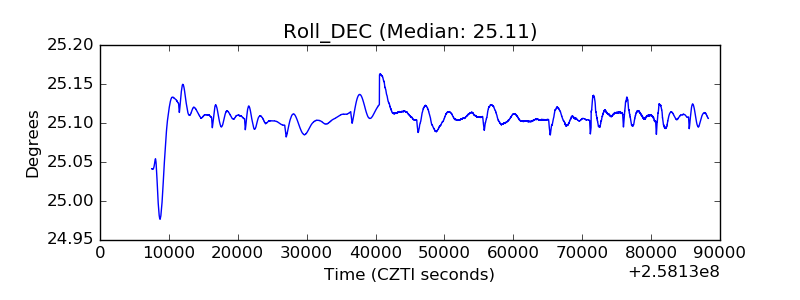 |
| _Roll_RA | 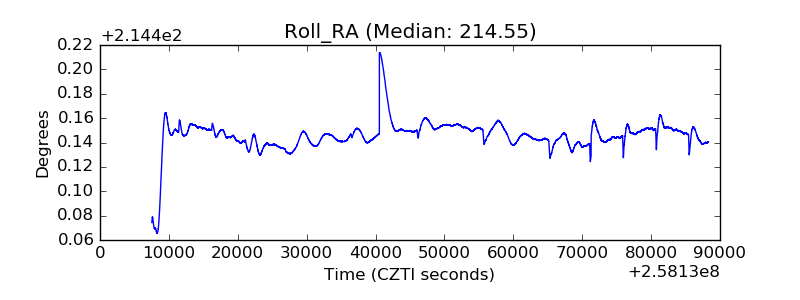 |
| Veto Counter | 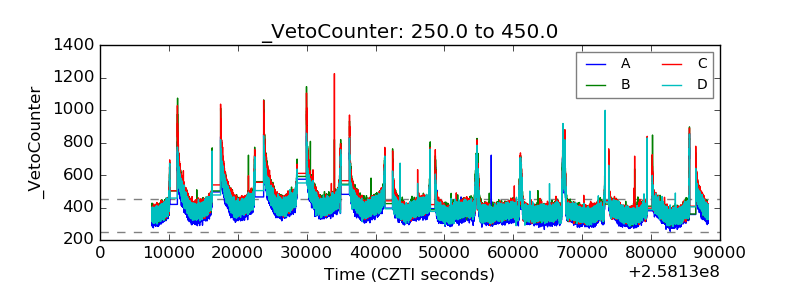 |