| Param | Original file | Final file |
|---|---|---|
| Filename | modeM0/AS1T02_012T07_9000001958cztM0_level2_bc.evt | modeM0/AS1T02_012T07_9000001958cztM0_level2_quad_clean.evt |
| Size (bytes) | 1,002,113,280 | 287,124,480 |
| Size | 955.7 MB | 273.8 MB |
| Events in quadrant A | 5,496,343 | 1,838,926 |
| Events in quadrant B | 8,303,752 | 1,706,743 |
| Events in quadrant C | 4,954,548 | 1,838,451 |
| Events in quadrant D | 9,974,136 | 1,680,291 |
| Mode M9 | |||
|---|---|---|---|
| Quadrant | BADHDUFLAG | Total packets | Discarded packets |
| A | 0 | 50 | 0 |
| B | 0 | 50 | 0 |
| C | 0 | 50 | 0 |
| D | 0 | 50 | 0 |
| Mode M0 | |||
|---|---|---|---|
| Quadrant | BADHDUFLAG | Total packets | Discarded packets |
| A | 0 | 50211 | 0 |
| B | 0 | 64934 | 0 |
| C | 0 | 48878 | 0 |
| D | 0 | 70519 | 0 |
| Mode SS | |||
|---|---|---|---|
| Quadrant | BADHDUFLAG | Total packets | Discarded packets |
| A | 0 | 480 | 0 |
| B | 0 | 480 | 0 |
| C | 0 | 480 | 0 |
| D | 0 | 480 | 0 |
| Quadrant | Total seconds | Saturated seconds | Saturation percentage |
|---|---|---|---|
| A | 23702 | 208 | 0.877563% |
| B | 23702 | 2491 | 10.509662% |
| C | 23702 | 143 | 0.603325% |
| D | 23702 | 1861 | 7.851658% |
Noise dominated data is calculated using 1-second bins in cleaned event files. If a bin has >2000 counts, and if more than 50% of those come from <1% of pixels, then it is considered to be noise-dominated and hence unusable.
| Quadrant | # 1 sec bins | Bins with >0 counts | Bins with >2000 counts | High rate bins dominated by noise | Noise dominated (total time) | Noise dominated (detector-on time) | Marked lightcurve |
|---|---|---|---|---|---|---|---|
| A | 28608 | 23704 | 0 | 0 | 0.00% | 0.00% |  |
| B | 28608 | 23646 | 321 | 321 | 1.12% | 1.36% |  |
| C | 28608 | 23706 | 12 | 12 | 0.04% | 0.05% | 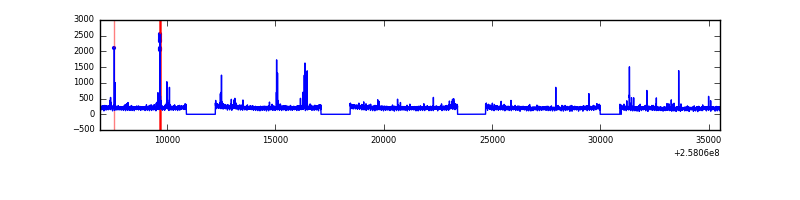 |
| D | 28608 | 23704 | 71 | 71 | 0.25% | 0.30% |  |
Top three noisy pixels from each quadrant. If the there are fewer than three noisy pixels in the level2.evt file, extra rows are filled as -1
| Pixel properties | Quadrant properties | ||||||
|---|---|---|---|---|---|---|---|
| Quadrant | DetID | PixID | Counts | Sigma | Mean | Median | Sigma |
| A | 12 | 189 | 280902 | 1034.44 | 1247 | 1221 | 270.4 |
| A | 8 | 15 | 223191 | 820.99 | 1247 | 1221 | 270.4 |
| A | 8 | 192 | 114290 | 418.2 | 1247 | 1221 | 270.4 |
| B | 4 | 239 | 3157994 | 14005.55 | 1195 | 1167 | 225.4 |
| B | 3 | 64 | 120289 | 528.5 | 1195 | 1167 | 225.4 |
| B | 0 | 219 | 117849 | 517.67 | 1195 | 1167 | 225.4 |
| C | 15 | 208 | 124616 | 453.61 | 1233 | 1218 | 272.0 |
| C | 13 | 61 | 7635 | 23.59 | 1233 | 1218 | 272.0 |
| C | 0 | 207 | 4981 | 13.83 | 1233 | 1218 | 272.0 |
| D | 13 | 122 | 3609424 | 13219.18 | 1190 | 1152 | 273.0 |
| D | 1 | 52 | 978688 | 3581.28 | 1190 | 1152 | 273.0 |
| D | 10 | 157 | 377768 | 1379.76 | 1190 | 1152 | 273.0 |
Histogram calculated using DETX and DETY for each event in the final _common_clean file
| Quadrant A |  |
 |
Quadrant B |
|---|---|---|---|
| Quadrant D |  |
 |
Quadrant C |
| Plot type | Count rate plots | Images |
|---|---|---|
| Comparison with Poisson distribution Blue bars denote a histogram of data divided into 1 sec bins. Red curve is a Poisson curve with rate = median count rate of data. |
 |
 |
| Quadrant-wise count rates Data is divided into 100 sec bins |
 |
|
| Module-wise count rates for Quadrant A Data is divided into 100 sec bins |
 |
 |
| Module-wise count rates for Quadrant B Data is divided into 100 sec bins |
 |
 |
| Module-wise count rates for Quadrant C Data is divided into 100 sec bins |
 |
 |
| Module-wise count rates for Quadrant D Data is divided into 100 sec bins |
 |
 |
| Parameter | Plot |
|---|---|
| CZT HV Monitor |  |
| D_VDD |  |
| Temperature 1 | 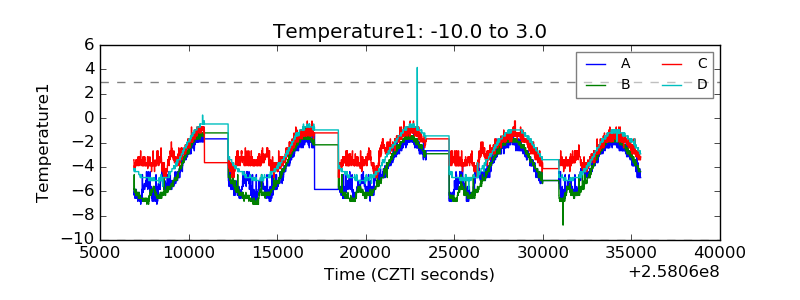 |
| Veto HV Monitor |  |
| Veto LLD |  |
| Alpha Counter |  |
| _CPM_Rate |  |
| CZT Counter |  |
| +2.5 Volts monitor |  |
| +5 Volts monitor |  |
| _ROLL_ROT | 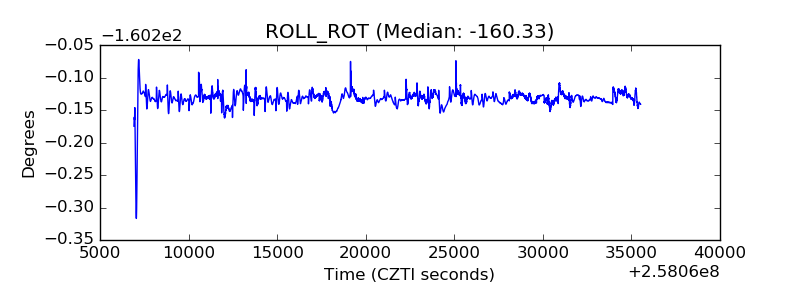 |
| _Roll_DEC |  |
| _Roll_RA |  |
| Veto Counter |  |