| Param | Original file | Final file |
|---|---|---|
| Filename | modeM0/AS1T02_012T06_9000001956cztM0_level2_bc.evt | modeM0/AS1T02_012T06_9000001956cztM0_level2_quad_clean.evt |
| Size (bytes) | 186,445,440 | 54,792,000 |
| Size | 177.8 MB | 52.3 MB |
| Events in quadrant A | 1,041,672 | 353,183 |
| Events in quadrant B | 2,145,179 | 288,196 |
| Events in quadrant C | 966,139 | 356,688 |
| Events in quadrant D | 1,169,050 | 335,516 |
| Mode M9 | |||
|---|---|---|---|
| Quadrant | BADHDUFLAG | Total packets | Discarded packets |
| A | 0 | 12 | 0 |
| B | 0 | 12 | 0 |
| C | 0 | 12 | 0 |
| D | 0 | 12 | 0 |
| Mode SS | |||
|---|---|---|---|
| Quadrant | BADHDUFLAG | Total packets | Discarded packets |
| A | 0 | 94 | 0 |
| B | 0 | 94 | 0 |
| C | 0 | 94 | 0 |
| D | 0 | 94 | 0 |
| Mode M0 | |||
|---|---|---|---|
| Quadrant | BADHDUFLAG | Total packets | Discarded packets |
| A | 0 | 9761 | 0 |
| B | 0 | 19015 | 0 |
| C | 0 | 9549 | 0 |
| D | 0 | 10433 | 0 |
| Quadrant | Total seconds | Saturated seconds | Saturation percentage |
|---|---|---|---|
| A | 4625 | 41 | 0.886486% |
| B | 4625 | 2064 | 44.627027% |
| C | 4625 | 27 | 0.583784% |
| D | 4625 | 55 | 1.189189% |
Noise dominated data is calculated using 1-second bins in cleaned event files. If a bin has >2000 counts, and if more than 50% of those come from <1% of pixels, then it is considered to be noise-dominated and hence unusable.
| Quadrant | # 1 sec bins | Bins with >0 counts | Bins with >2000 counts | High rate bins dominated by noise | Noise dominated (total time) | Noise dominated (detector-on time) | Marked lightcurve |
|---|---|---|---|---|---|---|---|
| A | 5866 | 4626 | 5 | 5 | 0.09% | 0.11% |  |
| B | 5866 | 4352 | 191 | 191 | 3.26% | 4.39% | 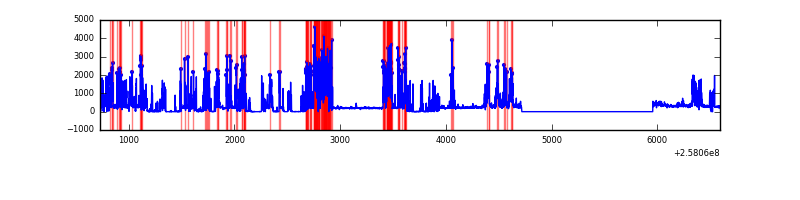 |
| C | 5866 | 4626 | 0 | 0 | 0.00% | 0.00% |  |
| D | 5866 | 4626 | 0 | 0 | 0.00% | 0.00% |  |
Top three noisy pixels from each quadrant. If the there are fewer than three noisy pixels in the level2.evt file, extra rows are filled as -1
| Pixel properties | Quadrant properties | ||||||
|---|---|---|---|---|---|---|---|
| Quadrant | DetID | PixID | Counts | Sigma | Mean | Median | Sigma |
| A | 12 | 189 | 48419 | 887.66 | 243 | 237 | 54.3 |
| A | 4 | 2 | 37883 | 693.56 | 243 | 237 | 54.3 |
| A | 2 | 79 | 6591 | 117.06 | 243 | 237 | 54.3 |
| B | 4 | 239 | 1460446 | 44006.05 | 163 | 158 | 33.2 |
| B | 0 | 214 | 15933 | 475.38 | 163 | 158 | 33.2 |
| B | 0 | 189 | 9631 | 285.47 | 163 | 158 | 33.2 |
| C | 15 | 208 | 9757 | 171.15 | 243 | 239 | 55.6 |
| C | 14 | 234 | 2571 | 41.93 | 243 | 239 | 55.6 |
| C | 8 | 222 | 1546 | 23.5 | 243 | 239 | 55.6 |
| D | 13 | 122 | 121661 | 2131.96 | 240 | 231 | 57.0 |
| D | 1 | 52 | 44951 | 785.15 | 240 | 231 | 57.0 |
| D | 14 | 34 | 23607 | 410.41 | 240 | 231 | 57.0 |
Histogram calculated using DETX and DETY for each event in the final _common_clean file
| Quadrant A |  |
 |
Quadrant B |
|---|---|---|---|
| Quadrant D |  |
 |
Quadrant C |
| Plot type | Count rate plots | Images |
|---|---|---|
| Comparison with Poisson distribution Blue bars denote a histogram of data divided into 1 sec bins. Red curve is a Poisson curve with rate = median count rate of data. |
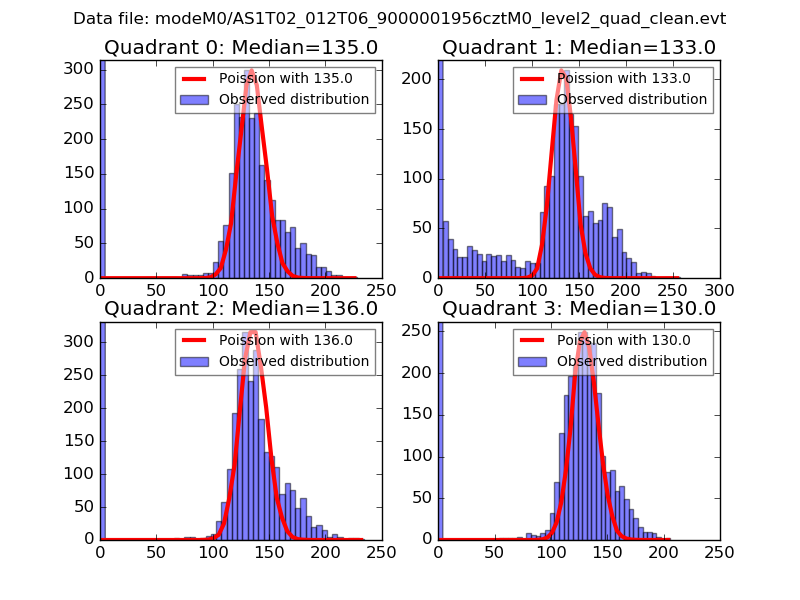 |
 |
| Quadrant-wise count rates Data is divided into 100 sec bins |
 |
|
| Module-wise count rates for Quadrant A Data is divided into 100 sec bins |
 |
 |
| Module-wise count rates for Quadrant B Data is divided into 100 sec bins |
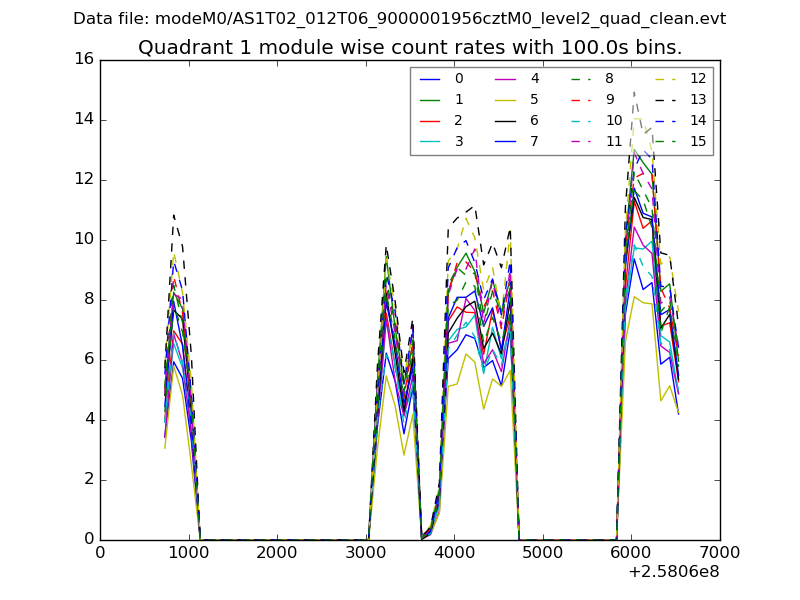 |
 |
| Module-wise count rates for Quadrant C Data is divided into 100 sec bins |
 |
 |
| Module-wise count rates for Quadrant D Data is divided into 100 sec bins |
 |
 |
| Parameter | Plot |
|---|---|
| CZT HV Monitor | 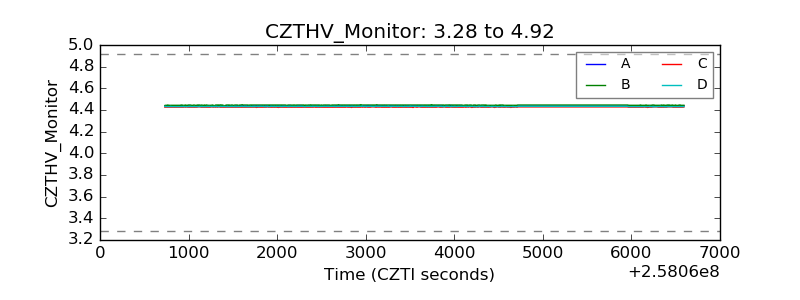 |
| D_VDD |  |
| Temperature 1 |  |
| Veto HV Monitor |  |
| Veto LLD |  |
| Alpha Counter |  |
| _CPM_Rate |  |
| CZT Counter | 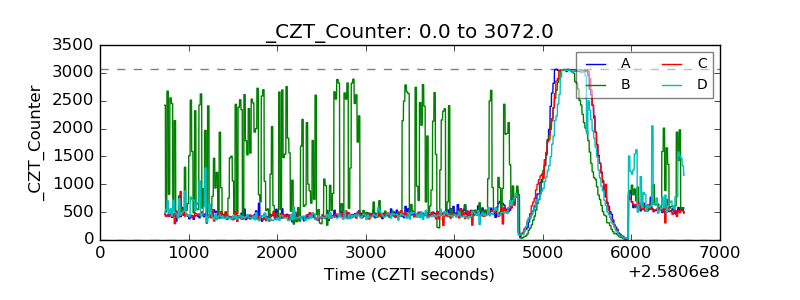 |
| +2.5 Volts monitor |  |
| +5 Volts monitor |  |
| _ROLL_ROT |  |
| _Roll_DEC |  |
| _Roll_RA |  |
| Veto Counter |  |