| Param | Original file | Final file |
|---|---|---|
| Filename | modeM0/AS1T02_012T05_9000001954cztM0_level2_bc.evt | modeM0/AS1T02_012T05_9000001954cztM0_level2_quad_clean.evt |
| Size (bytes) | 207,993,600 | 47,217,600 |
| Size | 198.4 MB | 45.0 MB |
| Events in quadrant A | 908,381 | 301,111 |
| Events in quadrant B | 2,726,012 | 238,303 |
| Events in quadrant C | 855,859 | 303,510 |
| Events in quadrant D | 1,505,380 | 281,860 |
| Mode M0 | |||
|---|---|---|---|
| Quadrant | BADHDUFLAG | Total packets | Discarded packets |
| A | 0 | 8920 | 0 |
| B | 0 | 20706 | 0 |
| C | 0 | 8827 | 0 |
| D | 0 | 11485 | 0 |
| Mode SS | |||
|---|---|---|---|
| Quadrant | BADHDUFLAG | Total packets | Discarded packets |
| A | 0 | 88 | 0 |
| B | 0 | 88 | 0 |
| C | 0 | 88 | 0 |
| D | 0 | 88 | 0 |
| Mode M9 | |||
|---|---|---|---|
| Quadrant | BADHDUFLAG | Total packets | Discarded packets |
| A | 0 | 12 | 0 |
| B | 0 | 12 | 0 |
| C | 0 | 12 | 0 |
| D | 0 | 12 | 0 |
| Quadrant | Total seconds | Saturated seconds | Saturation percentage |
|---|---|---|---|
| A | 4325 | 10 | 0.231214% |
| B | 4325 | 1990 | 46.011561% |
| C | 4325 | 10 | 0.231214% |
| D | 4325 | 176 | 4.069364% |
Noise dominated data is calculated using 1-second bins in cleaned event files. If a bin has >2000 counts, and if more than 50% of those come from <1% of pixels, then it is considered to be noise-dominated and hence unusable.
| Quadrant | # 1 sec bins | Bins with >0 counts | Bins with >2000 counts | High rate bins dominated by noise | Noise dominated (total time) | Noise dominated (detector-on time) | Marked lightcurve |
|---|---|---|---|---|---|---|---|
| A | 5506 | 4326 | 0 | 0 | 0.00% | 0.00% |  |
| B | 5506 | 4239 | 260 | 260 | 4.72% | 6.13% | 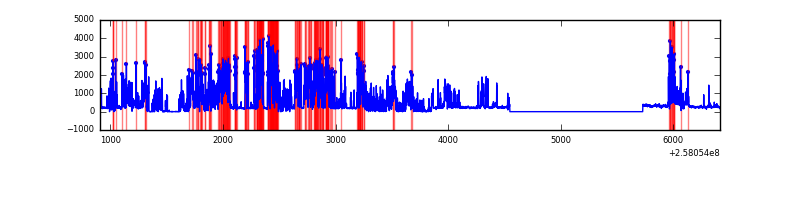 |
| C | 5506 | 4326 | 0 | 0 | 0.00% | 0.00% | 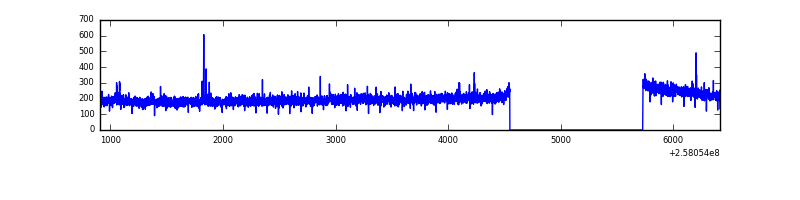 |
| D | 5506 | 4326 | 2 | 2 | 0.04% | 0.05% |  |
Top three noisy pixels from each quadrant. If the there are fewer than three noisy pixels in the level2.evt file, extra rows are filled as -1
| Pixel properties | Quadrant properties | ||||||
|---|---|---|---|---|---|---|---|
| Quadrant | DetID | PixID | Counts | Sigma | Mean | Median | Sigma |
| A | 12 | 189 | 49554 | 976.12 | 218 | 213 | 50.5 |
| A | 4 | 2 | 7265 | 139.51 | 218 | 213 | 50.5 |
| A | 1 | 162 | 5025 | 95.2 | 218 | 213 | 50.5 |
| B | 4 | 239 | 2075194 | 66314.9 | 151 | 146 | 31.3 |
| B | 0 | 189 | 20914 | 663.71 | 151 | 146 | 31.3 |
| B | 0 | 214 | 15580 | 493.24 | 151 | 146 | 31.3 |
| C | 15 | 208 | 3165 | 58.33 | 217 | 214 | 50.6 |
| C | 13 | 61 | 1324 | 21.94 | 217 | 214 | 50.6 |
| C | 8 | 222 | 817 | 11.92 | 217 | 214 | 50.6 |
| D | 13 | 122 | 558063 | 10555.42 | 214 | 205 | 52.9 |
| D | 12 | 222 | 36667 | 689.91 | 214 | 205 | 52.9 |
| D | 1 | 52 | 36178 | 680.66 | 214 | 205 | 52.9 |
Histogram calculated using DETX and DETY for each event in the final _common_clean file
| Quadrant A | 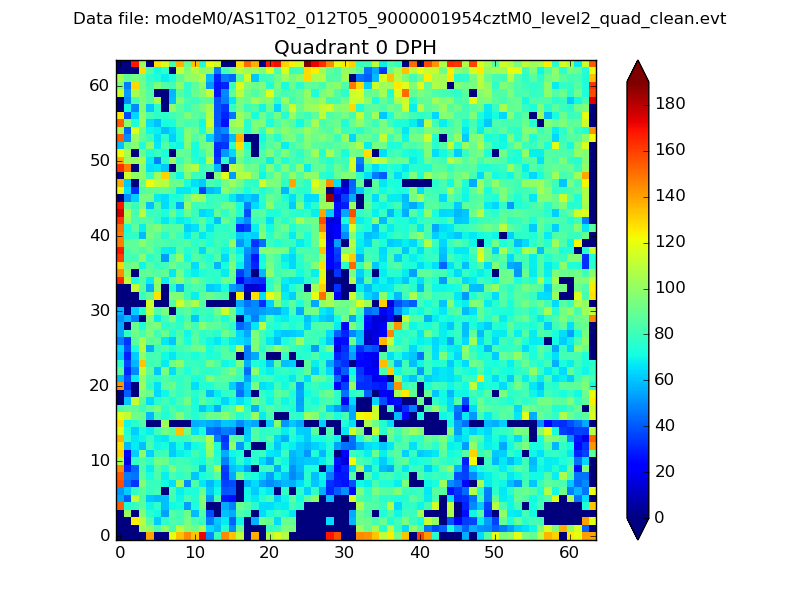 |
 |
Quadrant B |
|---|---|---|---|
| Quadrant D |  |
 |
Quadrant C |
| Plot type | Count rate plots | Images |
|---|---|---|
| Comparison with Poisson distribution Blue bars denote a histogram of data divided into 1 sec bins. Red curve is a Poisson curve with rate = median count rate of data. |
 |
 |
| Quadrant-wise count rates Data is divided into 100 sec bins |
 |
|
| Module-wise count rates for Quadrant A Data is divided into 100 sec bins |
 |
 |
| Module-wise count rates for Quadrant B Data is divided into 100 sec bins |
 |
 |
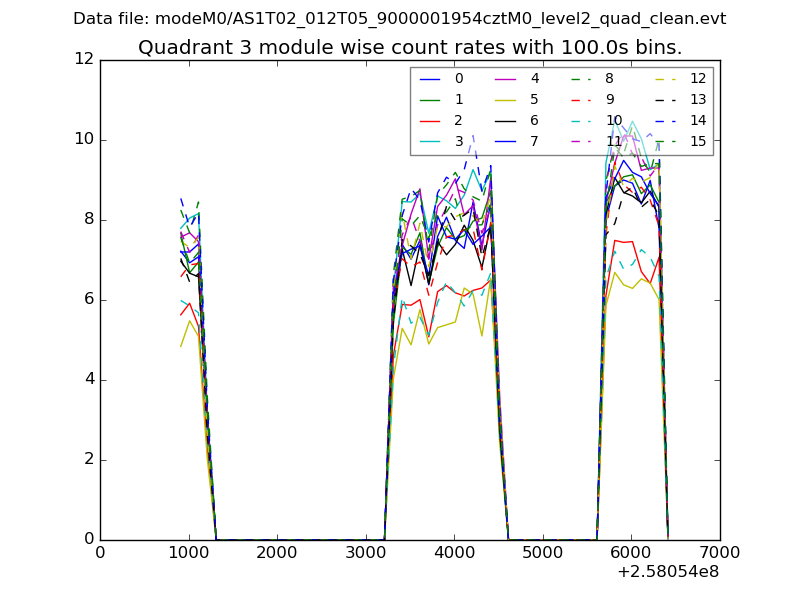
| Module-wise count rates for Quadrant C Data is divided into 100 sec bins |
 |
 |
| Module-wise count rates for Quadrant D Data is divided into 100 sec bins |
 |
 |
| Parameter | Plot |
|---|---|
| CZT HV Monitor |  |
| D_VDD | 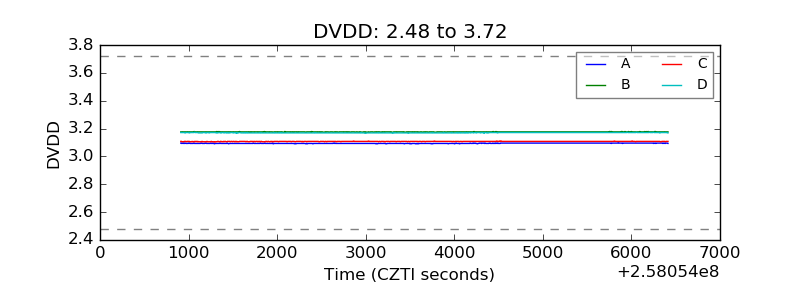 |
| Temperature 1 |  |
| Veto HV Monitor | 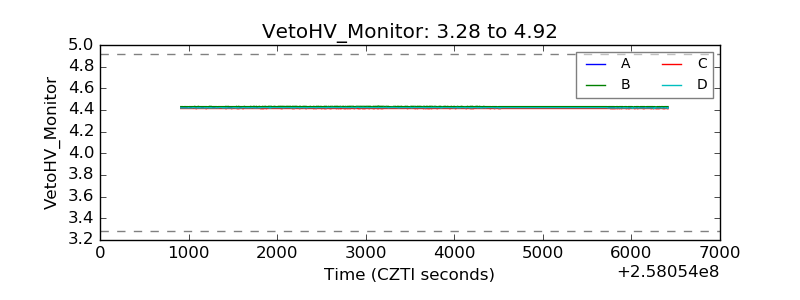 |
| Veto LLD |  |
| Alpha Counter | 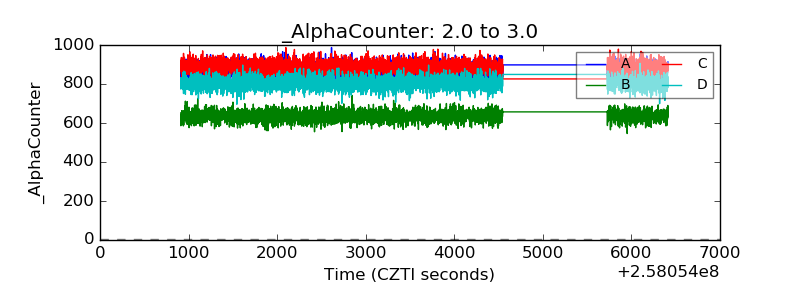 |
| _CPM_Rate |  |
| CZT Counter |  |
| +2.5 Volts monitor |  |
| +5 Volts monitor |  |
| _ROLL_ROT |  |
| _Roll_DEC |  |
| _Roll_RA |  |
| Veto Counter |  |