| Param | Original file | Final file |
|---|---|---|
| Filename | modeM0/AS1T02_012T04_9000001952cztM0_level2_bc.evt | modeM0/AS1T02_012T04_9000001952cztM0_level2_quad_clean.evt |
| Size (bytes) | 235,906,560 | 48,323,520 |
| Size | 225.0 MB | 46.1 MB |
| Events in quadrant A | 915,939 | 306,872 |
| Events in quadrant B | 3,048,763 | 261,920 |
| Events in quadrant C | 860,460 | 307,753 |
| Events in quadrant D | 2,008,513 | 273,632 |
| Mode M0 | |||
|---|---|---|---|
| Quadrant | BADHDUFLAG | Total packets | Discarded packets |
| A | 0 | 9101 | 0 |
| B | 0 | 18925 | 0 |
| C | 0 | 8981 | 0 |
| D | 0 | 13637 | 0 |
| Mode SS | |||
|---|---|---|---|
| Quadrant | BADHDUFLAG | Total packets | Discarded packets |
| A | 0 | 92 | 0 |
| B | 0 | 92 | 0 |
| C | 0 | 92 | 0 |
| D | 0 | 92 | 0 |
| Mode M9 | |||
|---|---|---|---|
| Quadrant | BADHDUFLAG | Total packets | Discarded packets |
| A | 0 | 10 | 0 |
| B | 0 | 10 | 0 |
| C | 0 | 10 | 0 |
| D | 0 | 10 | 0 |
| Quadrant | Total seconds | Saturated seconds | Saturation percentage |
|---|---|---|---|
| A | 4435 | 19 | 0.428410% |
| B | 4435 | 1550 | 34.949267% |
| C | 4435 | 9 | 0.202931% |
| D | 4435 | 445 | 10.033822% |
Noise dominated data is calculated using 1-second bins in cleaned event files. If a bin has >2000 counts, and if more than 50% of those come from <1% of pixels, then it is considered to be noise-dominated and hence unusable.
| Quadrant | # 1 sec bins | Bins with >0 counts | Bins with >2000 counts | High rate bins dominated by noise | Noise dominated (total time) | Noise dominated (detector-on time) | Marked lightcurve |
|---|---|---|---|---|---|---|---|
| A | 5506 | 4436 | 0 | 0 | 0.00% | 0.00% | 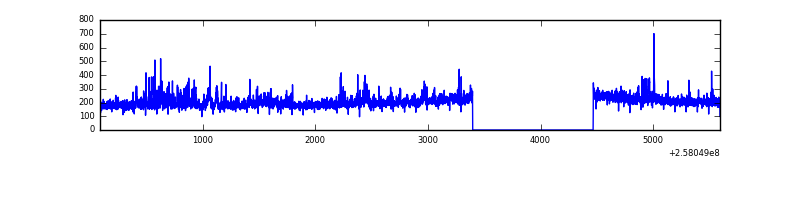 |
| B | 5506 | 4380 | 308 | 308 | 5.59% | 7.03% |  |
| C | 5506 | 4436 | 0 | 0 | 0.00% | 0.00% |  |
| D | 5506 | 4435 | 76 | 76 | 1.38% | 1.71% |  |
Top three noisy pixels from each quadrant. If the there are fewer than three noisy pixels in the level2.evt file, extra rows are filled as -1
| Pixel properties | Quadrant properties | ||||||
|---|---|---|---|---|---|---|---|
| Quadrant | DetID | PixID | Counts | Sigma | Mean | Median | Sigma |
| A | 12 | 189 | 54806 | 1094.34 | 218 | 212 | 49.9 |
| A | 4 | 2 | 8174 | 159.6 | 218 | 212 | 49.9 |
| A | 1 | 162 | 4671 | 89.38 | 218 | 212 | 49.9 |
| B | 4 | 239 | 2300983 | 63594.19 | 174 | 169 | 36.2 |
| B | 0 | 189 | 15335 | 419.19 | 174 | 169 | 36.2 |
| B | 0 | 218 | 13168 | 359.29 | 174 | 169 | 36.2 |
| C | 15 | 208 | 6245 | 119.08 | 218 | 214 | 50.6 |
| C | 13 | 61 | 1276 | 20.97 | 218 | 214 | 50.6 |
| C | 8 | 222 | 1038 | 16.27 | 218 | 214 | 50.6 |
| D | 13 | 122 | 550689 | 10802.88 | 207 | 199 | 51.0 |
| D | 1 | 52 | 449003 | 8807.38 | 207 | 199 | 51.0 |
| D | 14 | 34 | 124720 | 2443.61 | 207 | 199 | 51.0 |
Histogram calculated using DETX and DETY for each event in the final _common_clean file
| Quadrant A |  |
 |
Quadrant B |
|---|---|---|---|
| Quadrant D |  |
 |
Quadrant C |
| Plot type | Count rate plots | Images |
|---|---|---|
| Comparison with Poisson distribution Blue bars denote a histogram of data divided into 1 sec bins. Red curve is a Poisson curve with rate = median count rate of data. |
 |
 |
| Quadrant-wise count rates Data is divided into 100 sec bins |
 |
|
| Module-wise count rates for Quadrant A Data is divided into 100 sec bins |
 |
 |
| Module-wise count rates for Quadrant B Data is divided into 100 sec bins |
 |
 |
| Module-wise count rates for Quadrant C Data is divided into 100 sec bins |
 |
 |
| Module-wise count rates for Quadrant D Data is divided into 100 sec bins |
 |
 |
| Parameter | Plot |
|---|---|
| CZT HV Monitor |  |
| D_VDD |  |
| Temperature 1 | 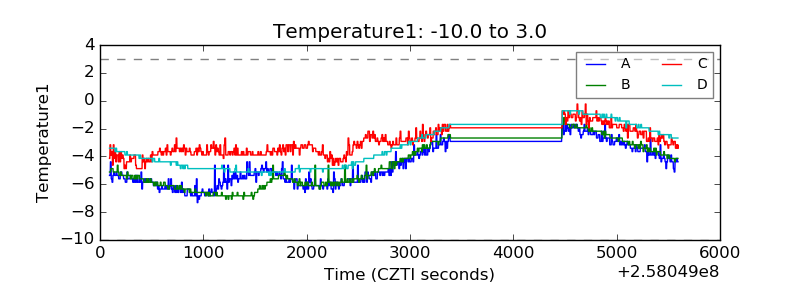 |
| Veto HV Monitor |  |
| Veto LLD |  |
| Alpha Counter |  |
| _CPM_Rate |  |
| CZT Counter |  |
| +2.5 Volts monitor | 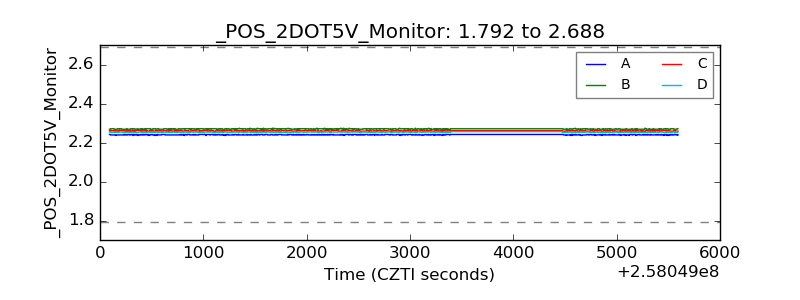 |
| +5 Volts monitor |  |
| _ROLL_ROT |  |
| _Roll_DEC |  |
| _Roll_RA |  |
| Veto Counter |  |